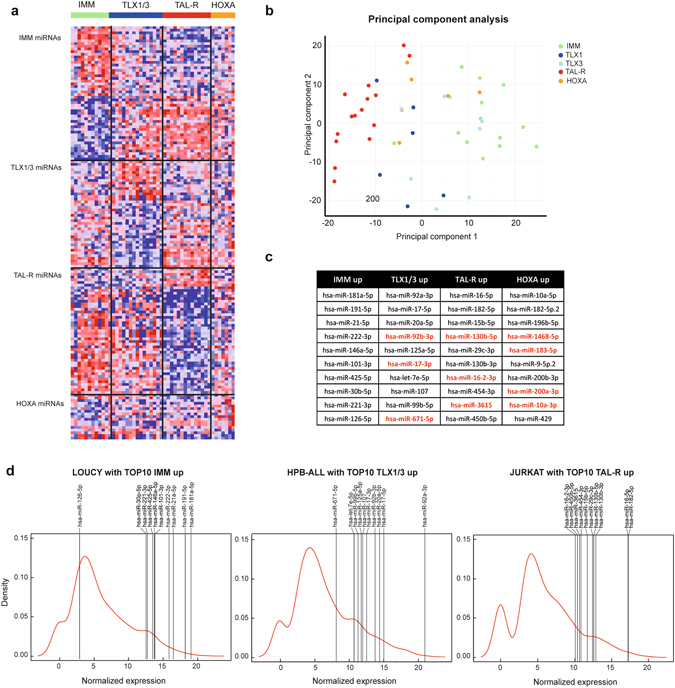
Figure 2.

Small RNA-sequencing of primary T-ALL samples reveals a subtype specific expression pattern of miRNAs. (a) Heatmap representing the top 50 most significantly up- or downregulated miRNAs per subgroup in comparison to the other subgroups (adjusted p-value < 0.05). (b) PCA-plot showing the distribution of the patient samples. The different colors denote patient samples from a different subgroup. (c) Table representing the selection of 10 miRNAs per subgroup. These were the highest expressed miRNAs that were significantly upregulated in that subgroup compared to the other subgroups. MiRNAs denoted in red were not detected by a previously used qRT-PCR platform. (d) Density plots representing the distribution of the miRNA expression in the LOUCY, HPB-ALL and JURKAT cell line. Vertical bars show the expression level of the top 10 miRNAs selected for the subgroup these cell lines represent. LOUCY represents the immature T-ALL subgroup, HPB-ALL the TLX1/3 subgroup and JURKAT the TAL-R subgroup.
