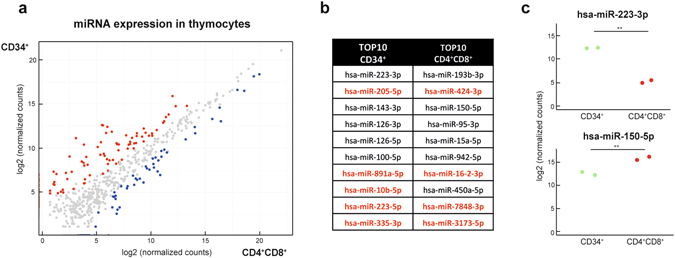
Figure 3.

MiRNA profiling of healthy thymocyte subsets reveals different miRNA expression profiles between CD34+ and CD4+CD8+ subsets. (a) Diagonal plot showing the expression of the miRNAs in the different thymocyte subsets. Red dots represent miRNAs that are significantly higher expressed in the CD34+ subset, blue dots are the miRNAs significantly higher expressed in the CD4+CD8+ subset. (b) Top 10 most significantly upregulated miRNAs for the CD34+ subset and for the CD4+CD8+ subset. MiRNAs denoted in red were not detected by a previously used qRT-PCR platform. (c) Dot plots of two representative miRNAs for the subsets. **Significant difference with an adjusted p-value < 0.001.
