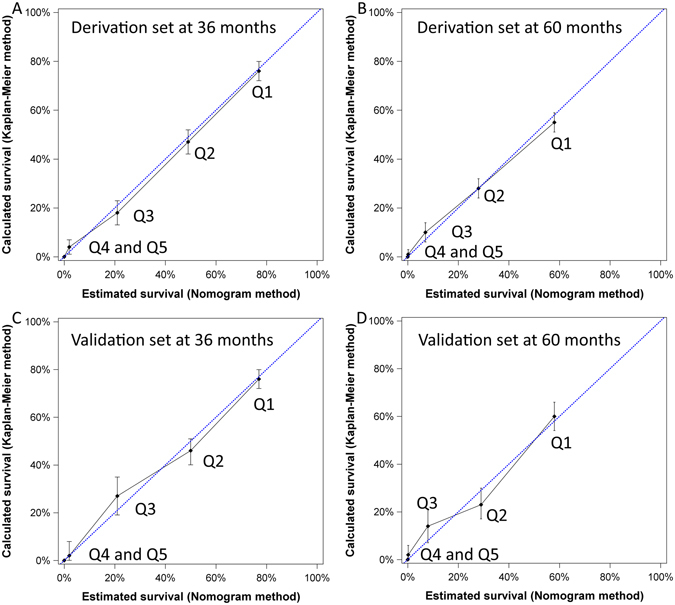
Figure 4.

The calibration plots of the nomogram of derivation and validation sets for 3- and 5-year survival predictions. The X-axis represents the nomogram-predicted survival and the Y-axis shows the mean survival and 95% confidence interval calculated by the Kaplan-Meier method. Patients were divided into quintiles (Q) to evaluate the accuracy of nomogram (Q1: ≤6, Q2: 6.1 to 12, Q3: 12.1 to 18, Q4: 18.1 to 24, Q5: >24). For patients from both derivation and validation sets, the calibration lines fit along with the 45-degree reference for both 3- and 5-year survival predictions except for patients nomogram point more than 24.
