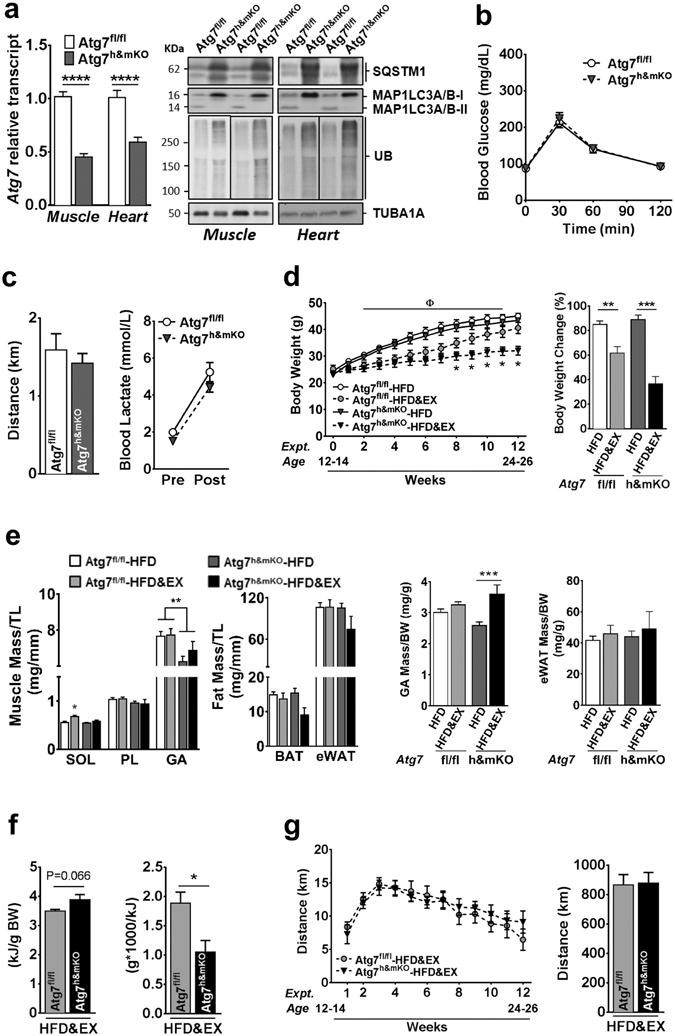
Figure 1.

Diet-induced obesity in exercise-trained Atg7h&mKO mice. (a) Atg7 mRNA and immunoblot representative images of the mean value for select autophagy and ubiquitinated proteins (UB) in muscle and heart (n = 11–15). (b) GTT (n = 14). (c) Distance run and blood lactate before (Pre) and after (Post) the endurance exercise capacity test (n = 11). (d) Body weight quantification and percentage change during the intervention (n = 8–11). (e) Muscle (Soleus-SOL, Plantaris-PL, Gastrocnemius-GA) and adipose (BAT and eWAT) masses normalized to tibia length (TL) and body weight (BW) (n = 6–11). (f) Average daily caloric intake, and feed efficiency (n = 6). (g) Weekly average of daily voluntary running activity, and total running distance during the intervention (n = 6). *P < 0.05, **P < 0.01, ***P < 0.001 ****P < 0.0001 in comparison to all other groups, unless otherwise represented; Φ P < 0.05 both Atg7fl/fl-HFD&EX and Atg7h&mKO-HFD&EX in comparison to respective HFD only, sedentary groups.
