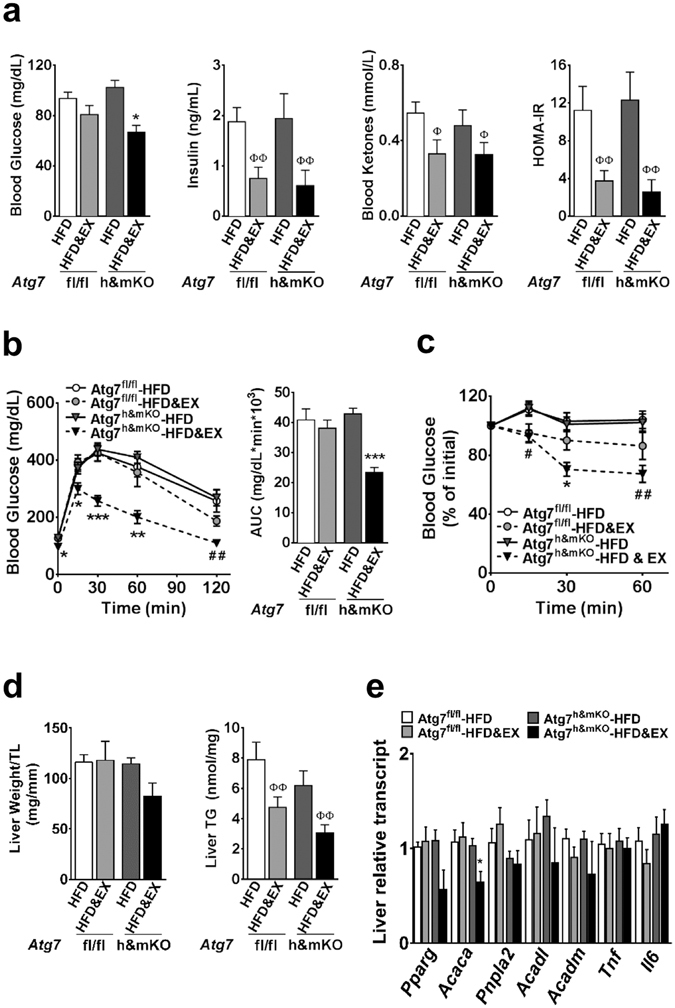
Figure 2.

Improved whole-body glucose homeostasis in exercise-trained Atg7h&mKO mice. (a) Overnight fasting blood levels of glucose, insulin, and ketones, and resulting HOMA-IR (n = 5–11). (b) GTT and respective area under the curve (AUC) (n = 8–11). (c) ITT (n = 8–11). (d) Liver mass normalized to tibia length (TL), and liver triglyceride (TG) content (n = 5–11). (e) mRNA of hepatic genes involved in lipid homeostasis and inflammation (n = 5–9). *P < 0.05, **P < 0.01 and ***P < 0.001 in comparison to all other groups; # P < 0.05, ## P < 0.01 in comparison to Atg7fl/fl-HFD and Atg7fl/fl-HFD&EX groups; and Φ P < 0.05, ΦΦ P < 0.01 in comparison to respective HFD only, sedentary group.
