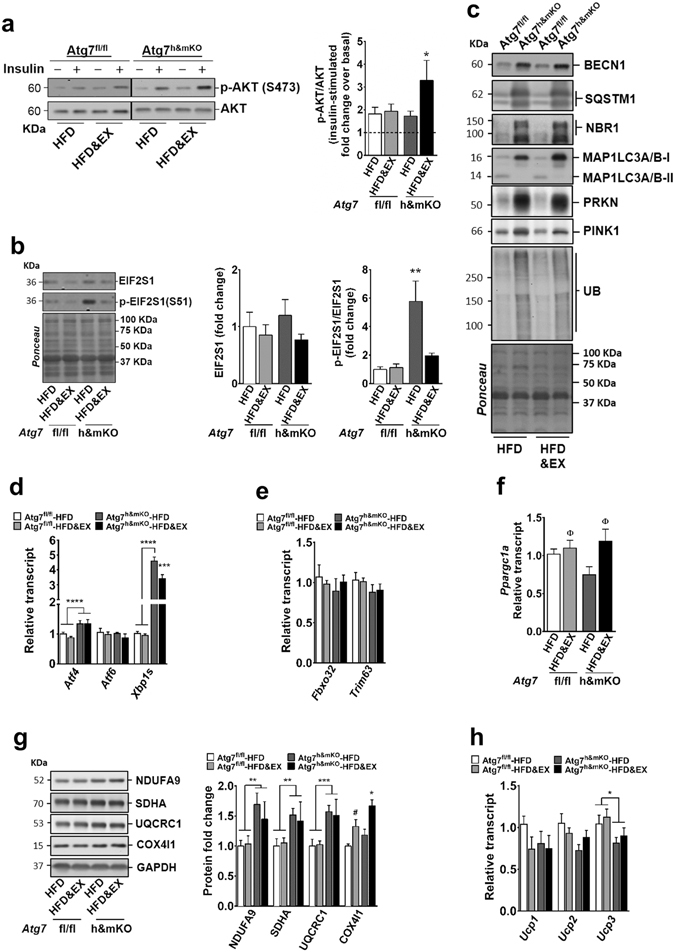
Figure 4.

Insulin signalling, ER stress and mitochondrial biogenesis are favourably modulated by exercise training in skeletal muscle of Atg7h&mKO mice. (a) Immunoblot representative images of the mean value (dividing lines indicate blots from different gels) and related quantification of phosphorylated AKT(S473) normalized to total AKT under basal and insulin-stimulated conditions (dashed line represents basal AKT phosphorylation) (n = 6–11). (b) Immunoblot representative images of the mean value and related quantification of total EIF2S1 normalized to ponceau staining, and phosphorylated EIF2S1(S51) normalized to total EIF2S1 (n = 5–6). (c) Immunoblot representative images of the mean value for select autophagy, mitophagy and ubiquitinated proteins (n = 4). (d) mRNA analysis of ER stress effector genes (n = 5–9). (e) mRNA analysis of E3 ubiquitin ligase genes (n = 5–9). (f) mRNA analysis of Ppargc1a (n = 5–9). (g) Immunoblot representative images of the mean value and quantification of mitochondrial proteins of complexes 1–4 of the Electron Transport Chain normalized to glyceraldehyde 3-phosphate dehydrogenase (GAPDH; n = 5–10). (h) mRNA analysis of Ucp1, Ucp2 and Ucp3 (n = 5–9). Full-length blots are presented in Supplementary Fig. S5. *P < 0.05, **P < 0.01, ***P < 0.001, ****P < 0.0001 in comparison to all other groups unless otherwise represented; Φ P < 0.05 in comparison to respective HFD only, sedentary group; and # P < 0.05 in comparison to Atf7fl/fl-HFD.
