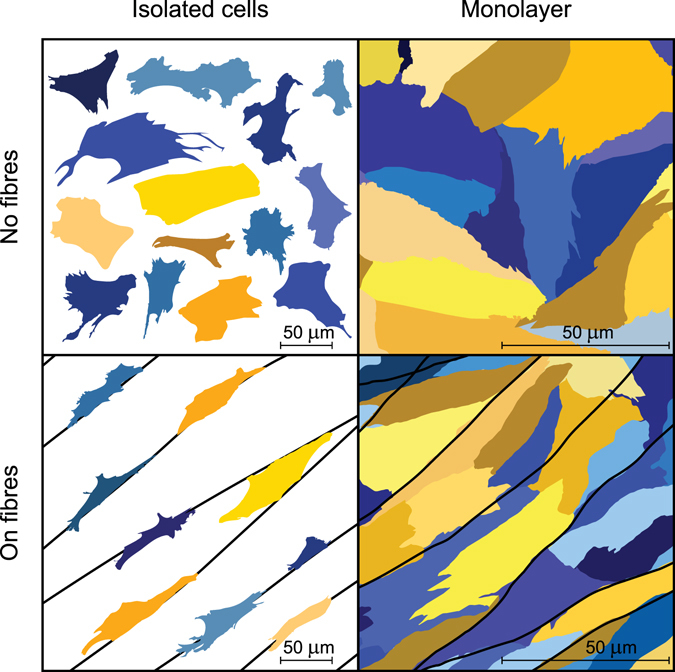
Figure 1.

Experimental cases considered in our study. The first column shows isolated cells seeded at a low density to avoid cell–cell interaction. The second column represents cells in the monolayer. The substrate was isotropic in the upper row, whereas in the second row, nanofibres were added. Cardiomyocytes are shown in yellow tints, whereas fibroblasts are shown in blue tints. This image was based on immunohistochemical data but was refined for illustrative purpose.
