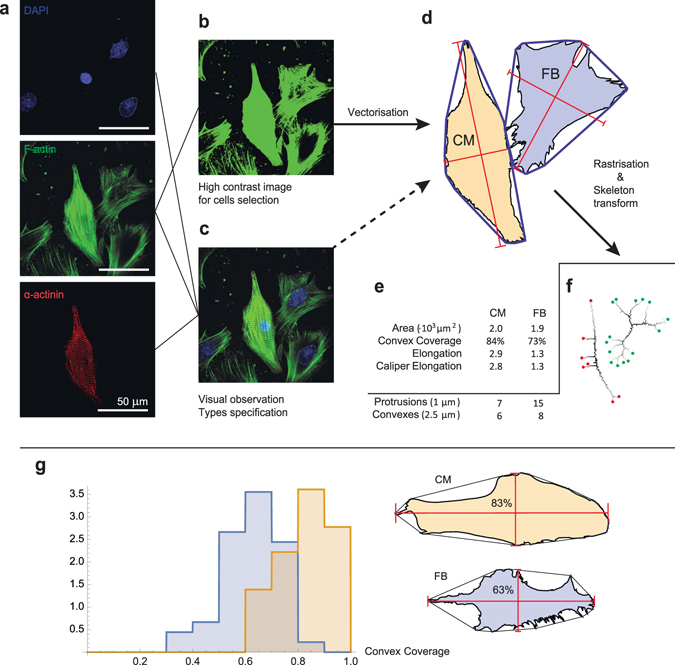
Figure 2.

Algorithm for cell shape analysis in the experiments. Cardiac cells were observed experimentally with the use of immunohistochemical techniques. Panel (a) shows raw data on cells stained with DAPI (DNA, blue), phalloidin (F-actin, green) and monoclonal anti-α-actinin antibody (α-actinin, red). Sub-figures (b) and (c) show the processed data used for cell contour selection and cell type classification. In (b), the contrast of F-actin staining was enhanced for cell contour selection. In (c), three channels were merged to obtain better cell representation for classification (cardiomyocyte vs. fibroblast). Sub-figure (d) shows the cell images obtained after segmentation. The convex hull is shown as a blue line around each cell. These images were used to obtain parameters such as area, convex hull coverage and elongations. Cell images were then rasterised with two resolutions (1 μm and 2.5 μm), and skeleton transform was applied (f). The number of skeleton endpoints at a high resolution was considered as the number of protrusions. All the measured parameters are listed in (e). For details, see section III B. (g) Distribution of the convex coverage for two cell types. CM–cardiomyocyte (n = 36), FB–fibroblast (n = 45). The histogram shows that FBs cover a much smaller area within the convex hull than CMs. The cell shapes of the median samples in the experimental database are shown on the right.
