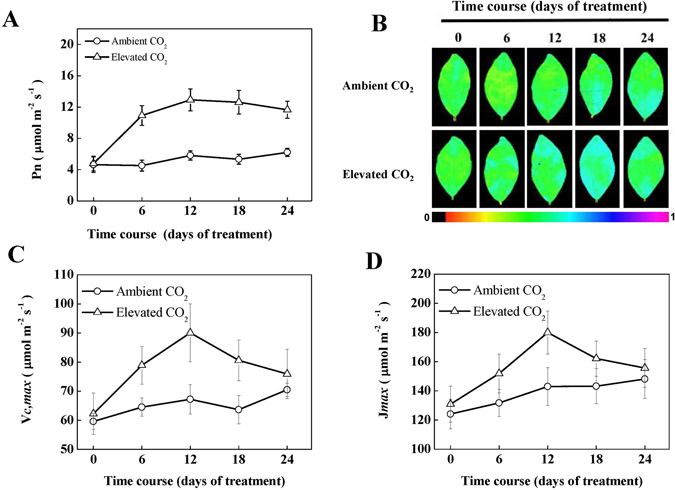
Figure 1.

Photosynthetic response of tea plants to elevated CO2. (A) Net photosynthetic rate (Pn), (B) the quantum efficiency of photosystem II (ΦPSII), false colour code depicted in the image ranges from 0 (black) to 1(purple), (C) maximum carboxylation rate of RuBisCO (V cmax), (D) maximum rates of RuBP regeneration (J max). Tea seedlings were exposed to either ambient (380 µmol mol−1) or elevated CO2 concentration (800 µmol mol−1) for 24 days. Measurements were taken at different time-points as mentioned in the respective figures. The results are expressed as the mean values ± SD, n = 6.
