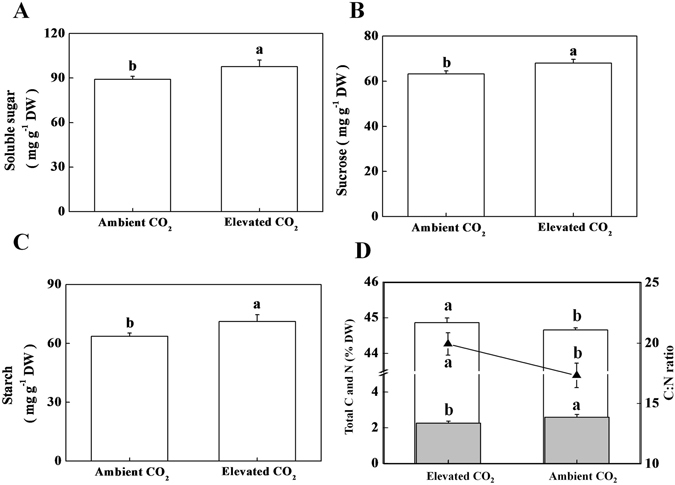
Figure 3.

Effect of ambient (380 µmol mol−1) or elevated CO2 concentration (800 µmol mol−1) on carbohydrate, carbon and nitrogen concentration in tea leaves. (A) Soluble sugar concentration, (B) Sucrose concentration, (C) Starch concentration, and (D) Total carbon, total nitrogen and C:N ratio. Histograms with solid fill color (■) and without fill color (□) represent total nitrogen and total carbon, respectively, while line graph (-▲-) represents C: N ratio. Leaf samples were harvested after exposure of tea plants to different concentrations of atmospheric CO2 for 24 days. Data are the means of four replicates (±SD). Mean denoted by different letters indicate significant differences between the treatments (P < 0.05).
