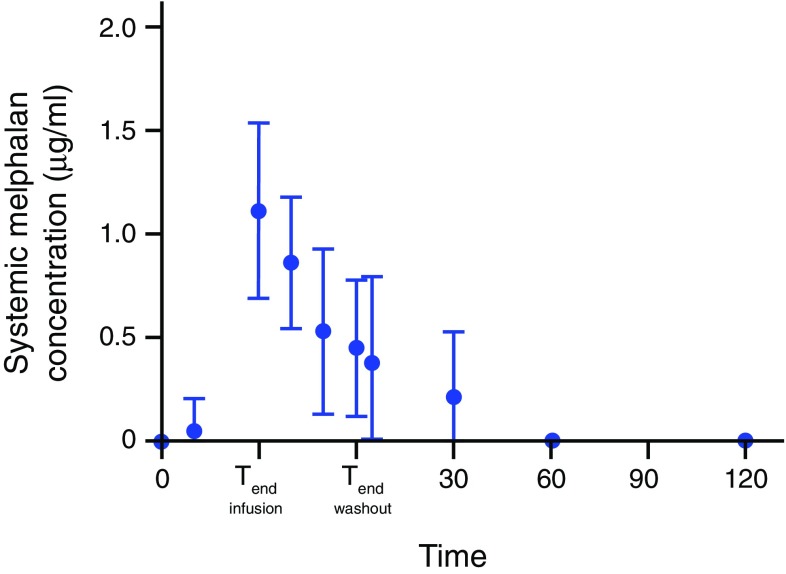
Fig. 3.
Mean systemic concentration of melphalan of all patients over time. A mean concentration of systemic melphalan was calculated at different time points; for all ten procedures, the bars indicate the standard deviation (SD). The horizontal dotted line at 0.5 µg/ml indicates the detection limit of melphalan in plasma

