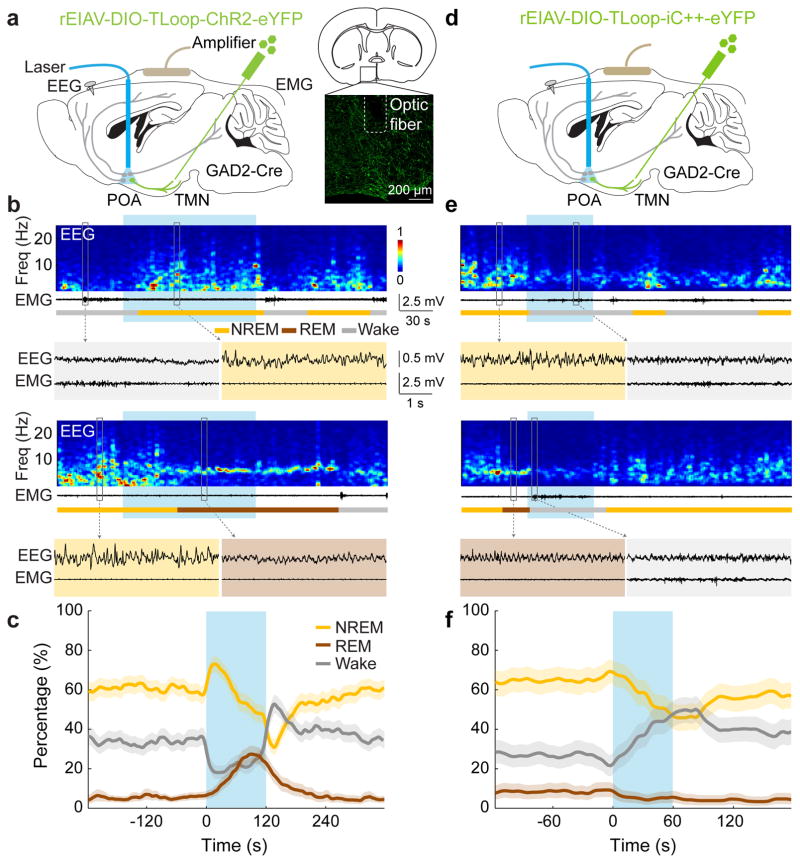
Figure 1. Optogenetic activation/inhibition of GABAPOA→TMN neurons enhances/suppresses sleep.
a, Schematic of optogenetic activation experiment. Right panel, fluorescence image of POA (box in schematic) in a GAD2-Cre mouse with rEIAV-DIO-TLoop-ChR2-eYFP injected into the TMN. Mouse brain figure adapted with permission from ref. 31. b, Two example trials. Shown are EEG power spectra, EMG traces, brain states (color coded), and EEG, EMG traces during selected periods (indicated by boxes) on an expanded time scale. Blue shading, laser stimulation (10 Hz, 120 s). c, Percentage of time in wake, NREM, or REM state before, during, and after laser stimulation (blue shading), averaged from 9 mice (P<0.0001 for laser-induced change from wake to sleep states, bootstrap). d, Schematic of optogenetic inhibition experiment. e, Two example trials. Blue shading, laser stimulation (constant light, 60 s). f, Percentage of time in wake, NREM, or REM state before, during, and after laser stimulation, averaged from 4 mice (P<0.0001 for wake, P=0.003 and 0.002 for REM and NREM, bootstrap). Shading for each trace, 95% confidence interval (CI).

