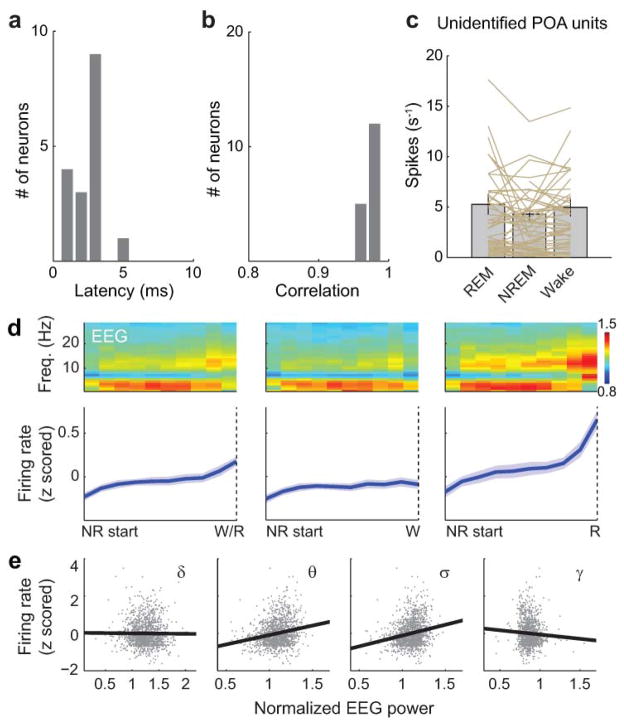
Extended Data Figure 6. Optogenetic identification of GABAPOA→TMN neurons, firing rates of unidentified POA neurons and firing rate dynamics of identified GABAPOA→TMN neurons during NREM sleep.
a, Distribution of delays in laser-evoked spiking for all identified neurons. Delay is defined as timing of the first spike after each laser pulse. b, Distribution of correlation coefficient between laser-evoked and spontaneous spike waveforms for all identified neurons. c, Firing rates of unidentified units in the three brain states. Each line represents data from one neuron. Grey bar represents average over units (n=51, from 11 mice). Error bar, ±s.e.m. d, Firing rate change of identified GABAPOA→TMN neurons during each NREM episode. Upper panel, mean EEG power spectrogram from start to end of each NREM episode. Lower panel, mean firing rate of the recorded neurons. Left, average across all NREM episodes. Each NREM period was divided into 10 time bins (temporally normalized). The firing rate of each neuron was z-scored and averaged across all recorded NREM episodes. Solid line, mean of 17 neurons, shading, ±s.e.m. To test significance of the firing rate increase during NREM episodes, for each unit we measured the slope of its mean firing rate vs. time after NREM onset, as quantified by a linear fit. Across the 17 units recorded, the increase (slope>0) was significant (P=1.0 × 10⁻⁵, t-test). Middle and Right, similar to left, for the subset of NREM episodes preceding wakefulness (P=0.0089) and that preceding REM sleep (P<10−5). The increase in firing rate was stronger for NREM episodes preceding REM sleep than those preceding wakefulness (P=0.0003, paired t-test). e, Correlation between firing rate and EEG power in different frequency bands (delta, 0.5–4 Hz; theta, 4–12 Hz; sigma, 9–25 Hz and gamma, 40–120 Hz) during NREM sleep. The firing rate of each neuron was z-scored, and the power within each frequency band was normalized by its mean across each recording session. Firing rates and EEG power in each frequency band were discretized in 2.5 s bins. For each bin assigned to NREM sleep, we plotted the power in each frequency bands vs. the corresponding firing rate. Linear regression was used to determine whether the power in each frequency band and the firing rate are positively or negatively correlated. The correlation was positive for theta (P<10−5) and sigma (P<10−5), negative for gamma (P<10−5), and not significant for delta (P=0.58).

