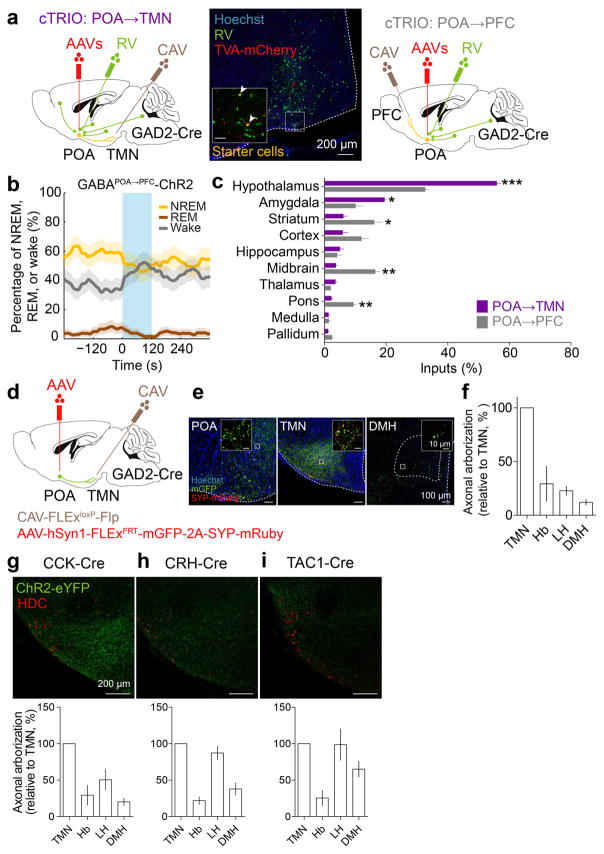
Extended Data Figure 7. Mapping of monosynaptic inputs and axon projections of GABAPOA→TMN neurons and axon projections of POA CCK, CRH, TAC1 neurons.
a, Schematic of cTRIO to map monosynaptic inputs to GABAPOA→TMN (left) or GABAPOA→PFC (right) neurons. Mouse brain figure adapted with permission from ref. 31. Middle, coronal section of a mouse brain at the POA stained with Hoechst (blue). A region within the square is magnified in the inset. Arrowheads indicate starter cells (yellow) at the injection site (scale bar in inset, 50μm). b, Optogenetic activation of GABAPOA→PFC neurons. Shown is the percentage of time in wake, NREM, or REM state before, during, and after laser stimulation (blue shading, 10 Hz, 120 s), averaged from 6 mice (P<0.001 for wake and NREM, P=0.003 for REM, bootstrap). Shading for each trace, 95% CI. c, Average fractional inputs in cTRIOPOA→TMN (purple) or cTRIOPOA→PFC (grey) tracing (P=0.0002 for hypothalamus, P=0.02 for amygdala, P=0.03 for striatum, P=0.001 for midbrain, P=0.003 for pons, t-test). n=3 mice in each group. Error bar, ±s.e.m. d, Schematic of the axon projection mapping experiment. e, Coronal sections containing POA, TMN, and DMH regions stained with Hoechst (blue). A region within the square is magnified in the inset. Red, synaptophysin-mRuby; green, mGFP. f, Projection levels (quantified by mGFP-labeled axonal arbors) in different brain areas normalized by that in the TMN. Shown are only areas with projections > 10% of the TMN projection. Hb, habenula; LH, lateral hypothalamus; DMH, dorsomedial hypothalamus. n=3 mice. g–i, Axon projections of POA CCK, CRH, TAC1 neurons. Upper panel, coronal section containing the TMN region. Red, immunostaining for HDC showing histaminergic neurons. Lower panel, projection levels (quantified by eYFP-labeled axonal arbors) in different brain areas normalized by that in the TMN. n=3,3,4 mice respectively.

