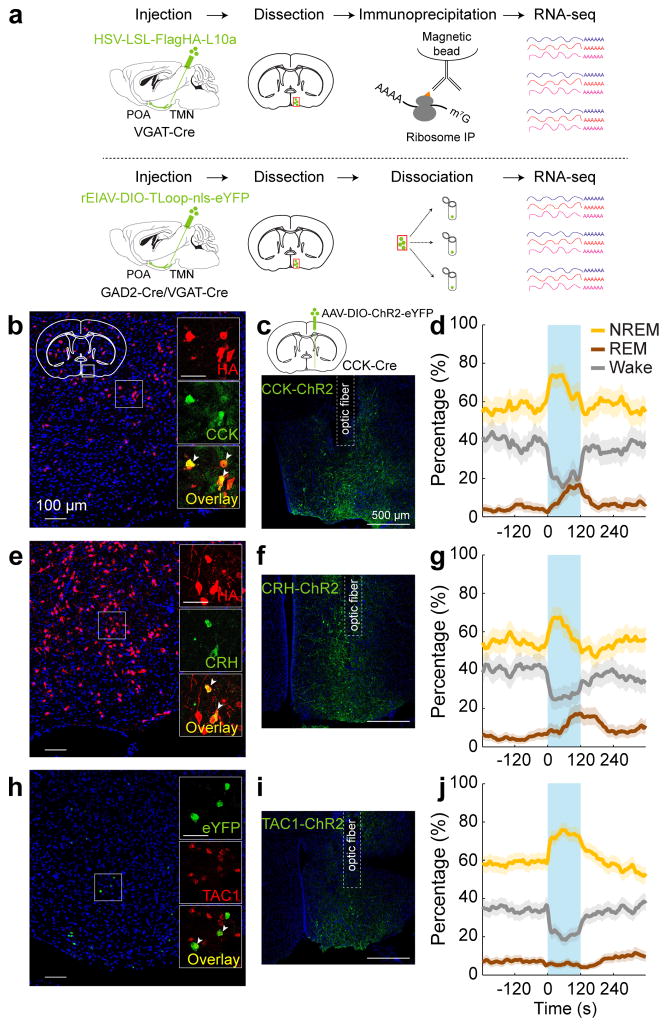
Figure 4. Identification of molecular markers for POA sleep neurons.
a, Schematics of TRAP (upper) and single-cell RNA-seq (lower) for gene profiling. Mouse brain figure adapted with permission from ref. 31. b, Overlap between HA labeling of GABAPOA→TMN neurons and CCK expression. Shown is a coronal section at the POA stained with HA antibody (red) and Hoechst (blue). Region within the square is magnified (inset; scale bar, 50 μm). Arrowheads, HA-labeled neurons stained with CCK antibody; 49.1±7.5% of HA+ neurons are CCK+ (n=3 mice). c, Schematic of optogenetic activation of POA CCK neurons (top) and a fluorescence image of POA in a CCK-Cre mouse injected with AAV-DIO-ChR2-eYFP. d, Percentage of time in wake, NREM, or REM state before, during, and after optogenetic stimulation (blue shading, 10 Hz, 120 s) of CCK neurons (P=0.0007 for REM, P<0.0001 for NREM and wake, bootstrap; n=4 mice). e, Overlap between HA labeling and CRH expression. 17.1±1.9% of HA-labeled neurons are CRH+ (arrowheads; n=3 mice). f, A fluorescence image of POA in a CRH-Cre mouse injected with AAV-DIO-ChR2-eYFP. g, Percentage of time in wake, NREM, or REM state, averaged from 5 CRH-Cre mice (P=0.0014 for NREM, P<0.0001 for REM and wake). h, Overlap between eYFP labeling of GABAPOA→TMN neurons and TAC1 expression. Arrowheads, eYFP+ neurons expressing TAC1 (fluorescence in situ hybridization, n=2 mice). i, A fluorescence image of POA in a TAC1-Cre mouse injected with AAV-DIO-ChR2-eYFP. j, Percentage of time in wake, NREM, or REM state, averaged from 7 TAC1-Cre mice (P<0.0001 for NREM and wake). Shading, 95% CI.

