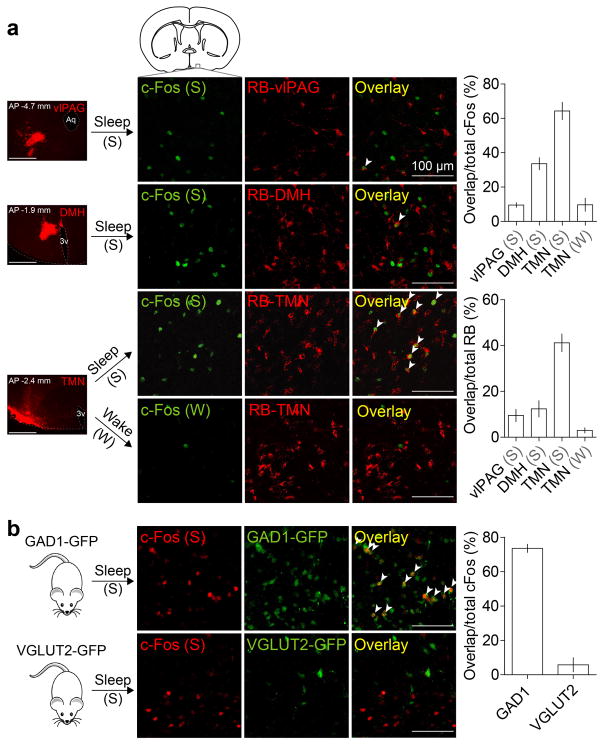
Extended Data Figure 1. Overlap of c-Fos staining of sleep-active POA neurons with retrograde labeling from several brain regions and with GAD1-GFP or VGLUT2-GFP.
a, Overlap between c-Fos expression induced by sleep rebound (Sleep, n=5 mice) or sleep deprivation (Wake, n=3) and retrobead (RB) labeling from tuberomammillary nucleus (TMN), dorsomedial hypothalamus (DMH, n=3) or ventrolateral periaqueductal grey (vlPAG, n=3). Mouse brain figure adapted with permission from ref. 31. Left column, representative images showing RB injection sites (scale bars, 500 μm). Percentage of c-Fos+ neurons containing RB and percentage of RB-containing cells that were c-Fos+ were both significantly different among target regions (P<0.0001 and P=0.0004, one-way ANOVA followed by Dunnett’s post-hoc test). Many RB-labeled neurons from TMN expressed c-Fos following sleep but not following wake. b, Overlap between c-Fos expression induced by sleep rebound and GAD1-GFP (top panel, 5 mice) or VGLUT2-GFP (bottom panel, 3 mice). Many c-Fos+ cells were GAD1+ (arrowheads). Error bar, ±s.e.m.

