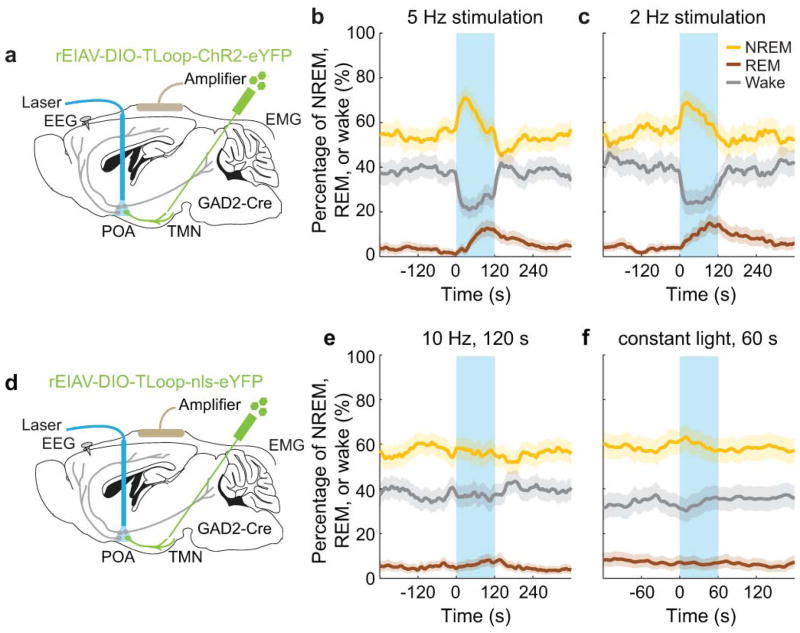
Extended Data Figure 3. Effect of optogenetic activation of GABAPOA→TMN neurons at low frequencies and effect of laser stimulation in GABAPOA→TMN-eYFP control mice.
a, Similar to Figure 1, rEIAV-DIO-TLoop-ChR2-eYFP was injected into the TMN of GAD2-Cre mice and an optic fiber was implanted into the POA for optogenetic stimulation. Mouse brain figure adapted with permission from ref. 31. b, Percentage of time the mice spent in wake, NREM, or REM state before, during, and after laser stimulation (blue shading, 5 Hz, 120 s), averaged from 5 mice (P<0.0001 for wake, REM and NREM, bootstrap). c, Similar to b, but with 2 Hz stimulation (P<0.0001 for wake and REM, P=0.002 for NREM, bootstrap, n=5 mice). d, Similar to a, after rEIAV-DIO-TLoop-nls-eYFP injection. e, Effect of 10 Hz stimulation in eYFP control mice. Shown is the percentage of time in wake, NREM, or REM state before, during, and after laser stimulation (blue shading, 10 Hz, 120 s), averaged from 8 mice (P=0.18, 0.84, and 0.35 for REM, NREM, and wake respectively, bootstrap). f, Effect of constant light stimulation (blue shading, constant light, 60 s), averaged from 5 mice (P=0.57, 0.27, and 0.73 for REM, NREM, and wake, bootstrap). Shading for each trace, 95% confidence interval (CI).

