
Figure 2.
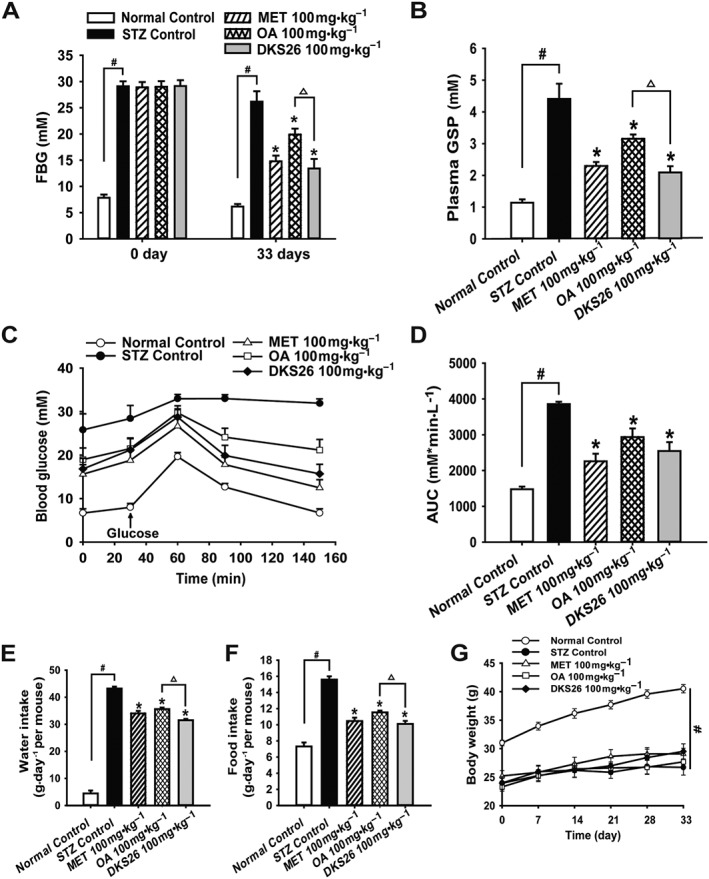
Effects of DKS26 on blood glucose, oral glucose tolerance, feeding and body weight in STZ‐induced diabetic mice after 33 days of administration. (A) The FBG on the first day and on the 33th day. (B) Plasma GSP levels. (C) and (D) Oral glucose tolerance test and the AUC. (E) Water intake expressed as the average of daily water consumption during the last week in each group of mice. (F) Food intake expressed as the average of daily food consumption during the last week in each group of mice. (G) Body weight. OA represents oleanolic acid; MET represents metformin. Values are expressed as mean ± SEM with normal control group n = 5, STZ control group n = 7 and other groups n = 8. Compared with normal control group, # P < 0.05; compared with STZ control group, * P < 0.05; compared with OA group, △ P < 0.05.