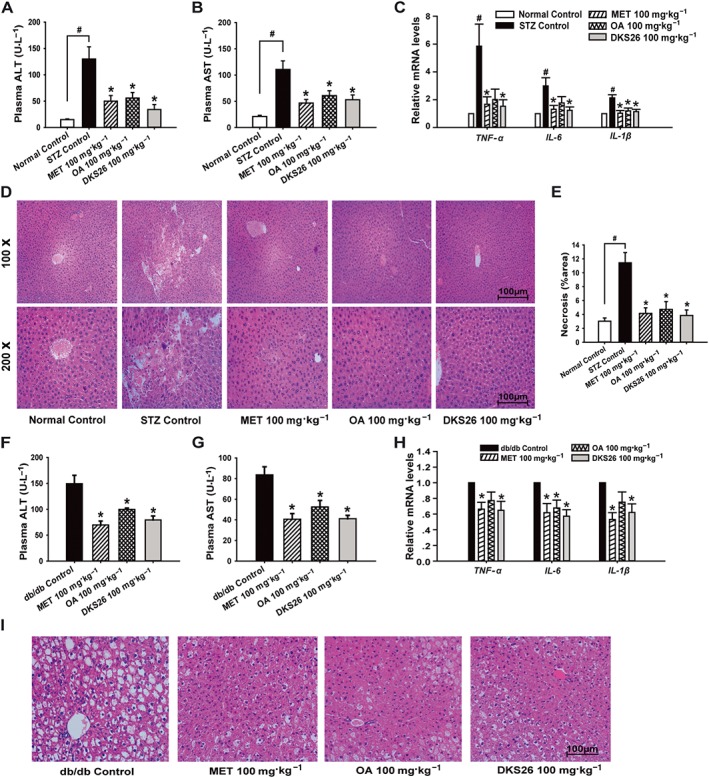
Figure 5.

Effects of DKS26 on liver function, inflammation‐related cytokine genes and histopathology in STZ‐induced and db/db diabetic mice. STZ‐induced diabetic mice: (A) and (B) plasma ALT and AST levels (normal control n = 5, STZ control n = 7 and other groups n = 8), (C) hepatic inflammation related TNF‐α, IL‐6 and IL‐1β mRNA levels (vs. β‐actin, normal control n = 5 and other groups n = 6), (D) liver histopathology by HE staining (normal control n = 5, STZ control n = 7 and other groups n = 8, 100× and 200×), (E) hepatic necrosis area (%) analysed by 5–6 HE staining photos of each liver samples (normal control n = 5, STZ control n = 7 and other groups n = 8, 100×). Db/db diabetic mice: (F) and (G) plasma ALT and AST levels (db/db and metformin control n = 7 and other groups n = 8), (H) hepatic inflammation‐related TNF‐α, IL‐6 and IL‐1β mRNA levels (vs. β‐actin, n = 6), (I) liver histopathology by HE staining (200×). OA represents oleanolic acid; MET represented metformin. Values are expressed as mean ± SEM. Compared with normal control group, # P < 0.05; compared with model control group (STZ control or db/db control), * P < 0.05.
