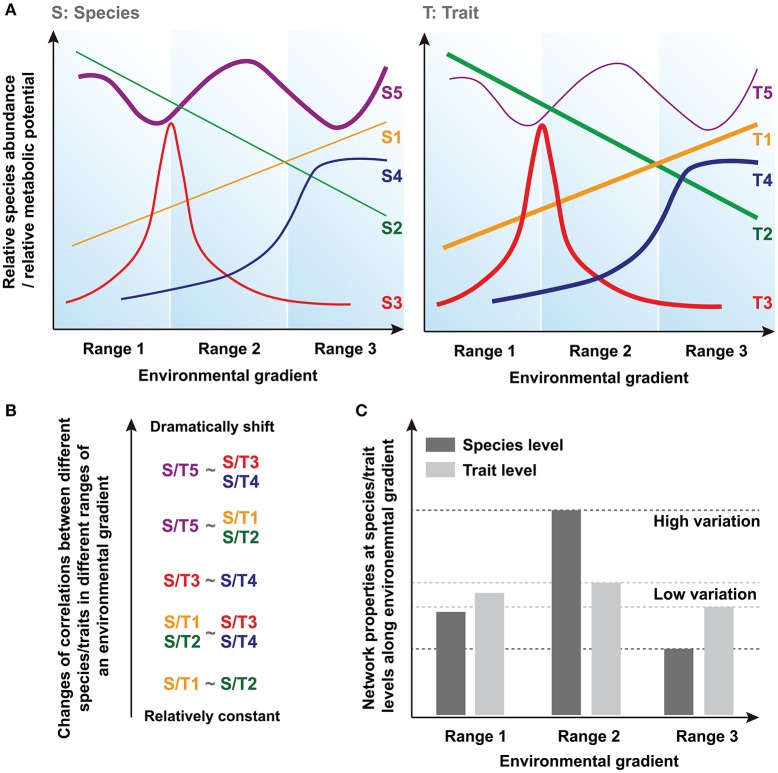
Figure 1.
Conceptual figures showing the hypotheses regarding the differences of network conservation between species and trait levels. (A) The relationships between a given environmental gradient and relative species abundance or relative metabolic potential. Line thickness represents the proportion of different types of species/traits in the acid mine drainage (AMD) communities. (B) Changes of corretions (i.e., correlation coefficients) between different species/traits in different ranges of an environmental gradient. (C) Network properties and their variations at species and traits levels along environmental gradient.

