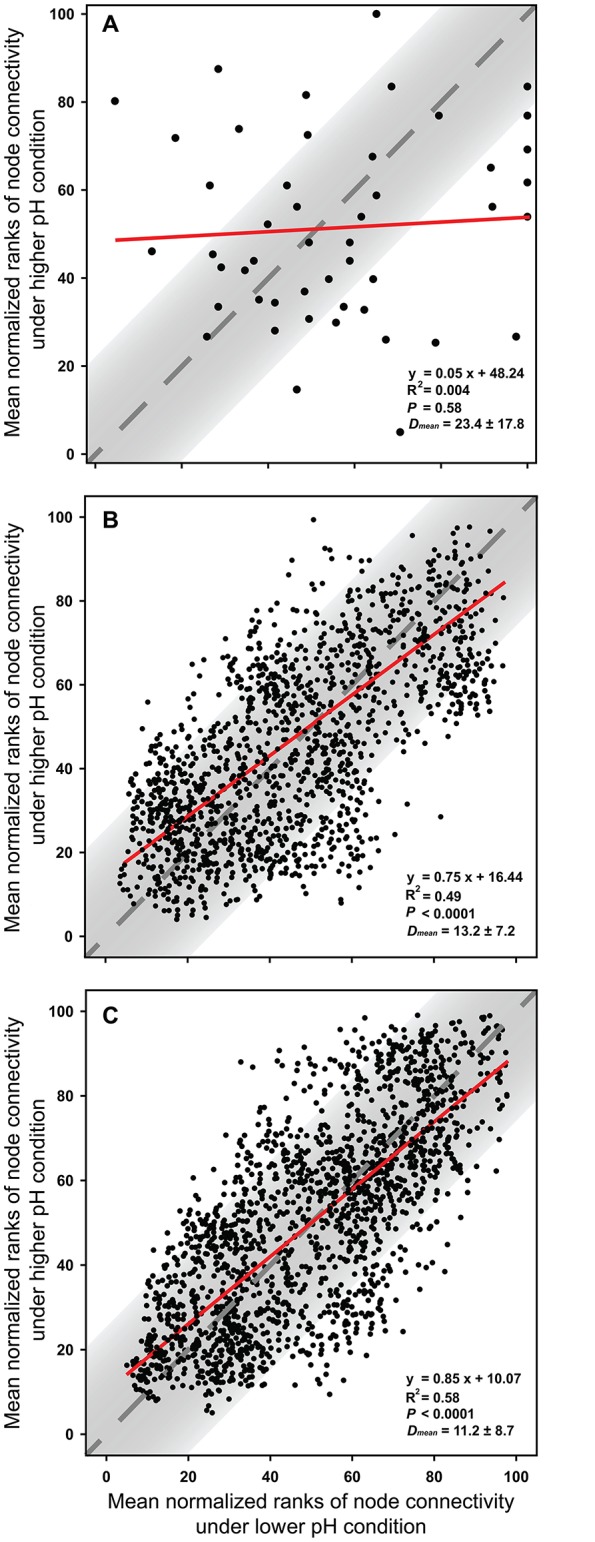
Figure 3.

The cross-validation results of normalized rank of node connectivity based on (A) OTUs, (B) GCps, and (C) KOs. The mean values of normalized rank of node connectivity under lower and higher pH were calculated using the data set of environmental group G1–G3 and G4–G6, respectively. Red lines show the best-fitted linear regression models, and the normalized ranks located within gray areas (OTUs: 50%; GCps: 76%; KOs: 79%) represent <20% of the difference between lower and higher pH conditions. D-values are the distances between normalized ranks of nodes and diagonal line. The Dmean (mean ± SD) were calculated based on the normalized ranks of 48, 2,501, and 2,129 nodes in OTUs, GCps, and KOs data sets, respectively.
