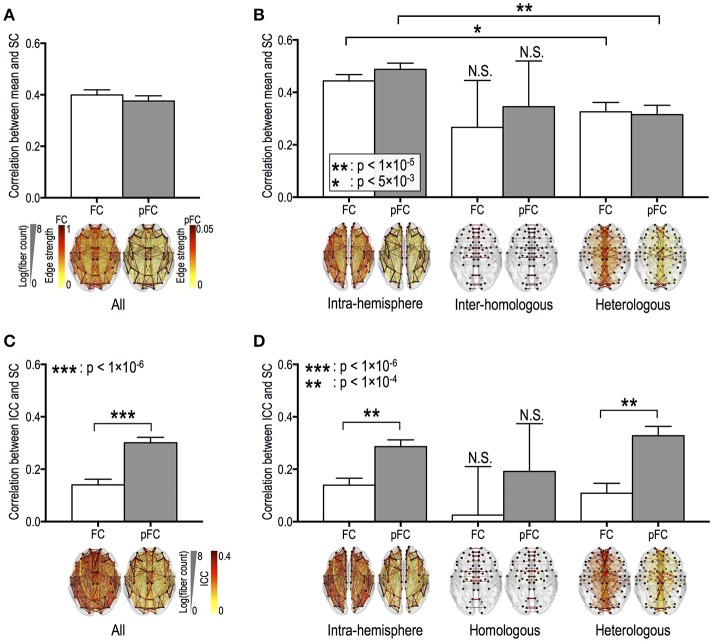
Figure 3.
Relationships between the stability of functional connectivity and structural connectivity according to edge types. The relationships between functional connectivity strength and structural connectivity (SC, defined by log-transformed fiber counts) for whole brain edges (A) and for intra-hemispheric edges and for inter-hemispheric homologous/heterologous edges (B). The relationships between intra-class correlations (ICCs, stability) of functional connectivity and log-transformed fiber counts in the different edge types (C,D). FC: Pearson correlation-based functional connectivity, pFC: partial correlation-based functional connectivity. N.S. represents “no significant difference.”

