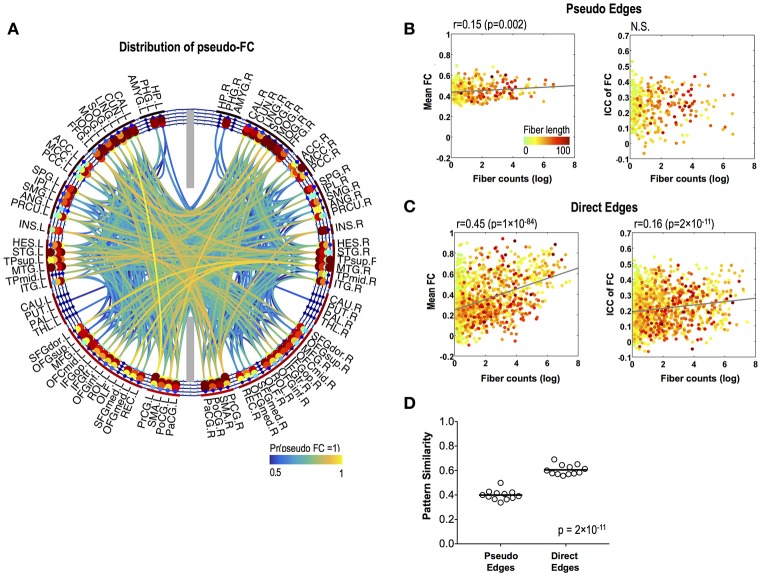
Figure 4.
Stability of pseudo-FC. (A) The spatial distribution of pseudo-FC. The relationships between the mean functional connectivity of FC and log-transformed fiber counts (left) and between the stability (ICC) of FC and log-transformed fiber counts (right) for pseudo edges (B) and direct edges (C). (D) Pattern similarity of FC within a subnetwork of pseudo functional edges and within a subnetwork of direct functional edges. The dots in (B,C) are colored according to the fiber lengths where we set greater than 100 to 100 mm for effective color-coding since such connections were very rare in our data.

