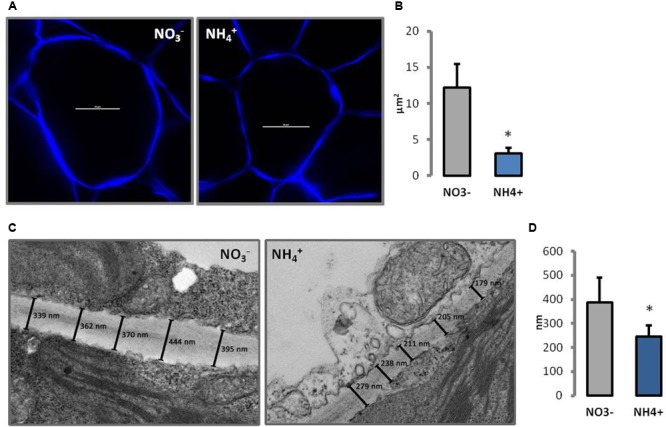
FIGURE 2.

Cell wall morphology of leaf mesophyll cells of plants growing on NH4+ and NO3– (control) as the only N source. (A) Cell wall visualization of individual palisade cells by Calcofluor White staining in CLSM (scale bar = 20 μm), and (B) cell size measurement from six independent biological replicates. (C) Ultrastructure of cell walls. The lines indicate the measured points in the cell wall. A representative of the 20 independent images that were used for measuring cell wall thickness (D).
