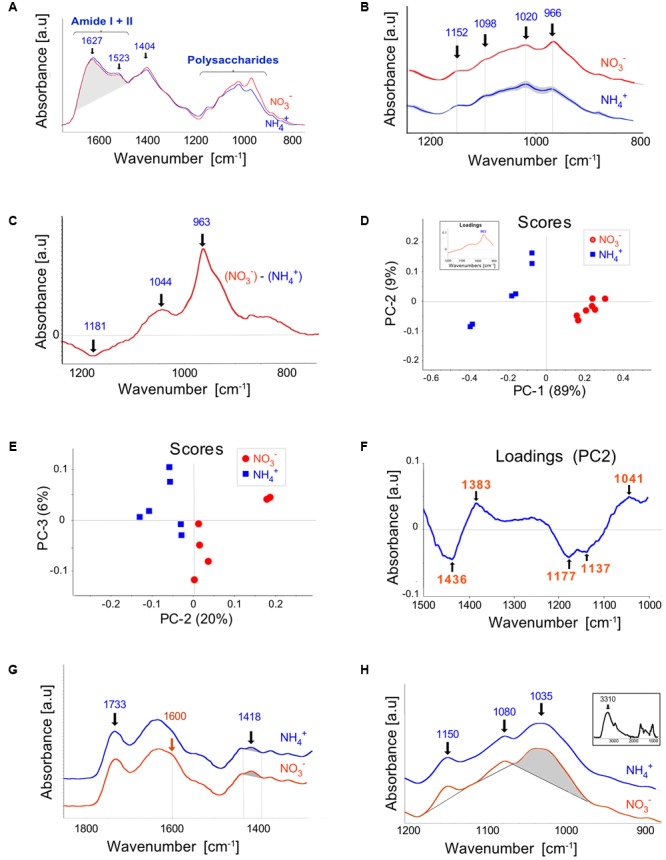
FIGURE 5.

Fourier Transform Infrared (FTIR) spectroscopy of cell walls extracted from leaves of Arabidopsis plants cultured on NH4+ and NO3– (control). (A) The spectra for the Amide I + II and the fingerprint regions normalized for an equal area between 1,760 and 880 cm-1. (B) The mean spectra with SD (gray ribbon) for the polysaccharide region. For better readability, they were offset along the absorbance axis. (C) Differential mean spectrum of the cell wall obtained by subtraction the spectrum for plants grown on NH4+ and NO3–. (D,E) PCA score plots discriminating plants growing on NH4+ and NO3–. Principal component 1 (PC1) explained 89% of the total variability within the spectral range between 1,200 and 900 cm-1 and PC2 explained 20% of the variability between 1500 and 1000 cm-1. Corresponding loadings are given as an inset in (D) and as the (F). Infrared spectra of (G) pectin-enriched and (H) hemicellulose-enriched extracts, respectively. The inset in (H) shows the whole-range spectrum for hemicellulose-enriched extracts. The relevant wavenumbers are denoted in the figures or shaded. The means were calculated for three independent experiments and two technical replicates.
