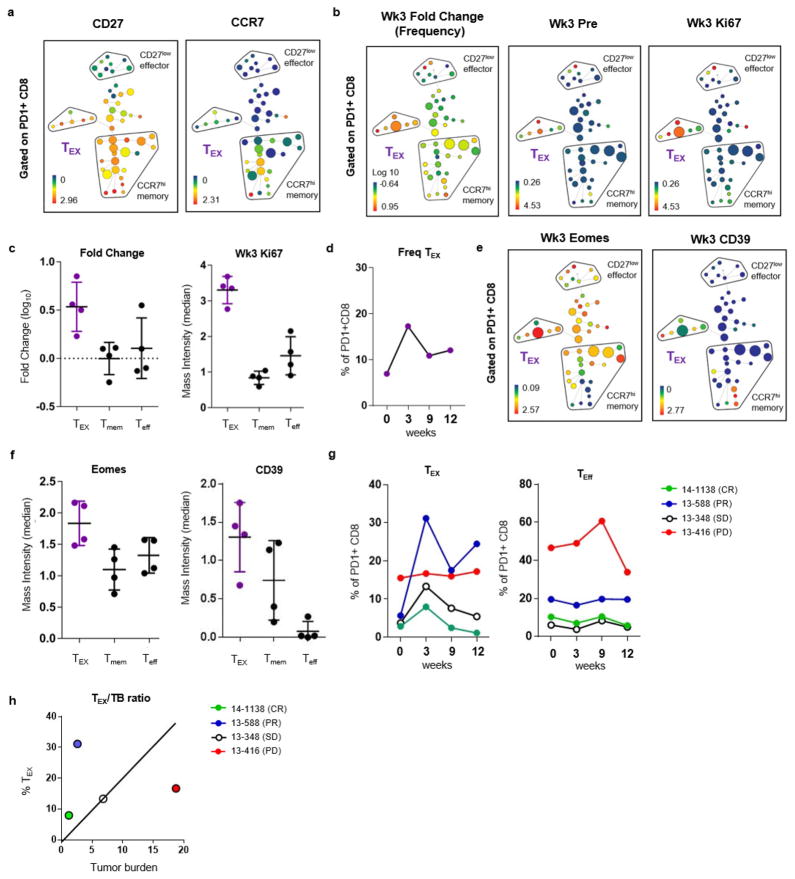
Extended Data Figure 6. Conventional differentiation state and clusters of Tex cells can be identified using CyTOF and high-dimensional visualization.
a–c, SPADE analysis applied to blood samples from patients with melanoma and analysed by CyTOF. a, SPADE tree showing MMI of CD27 (left) and CCR7 (right) (representative of 4 patients). b, SPADE tree coloured by median intensities of fold change frequency (left), and Ki67 expression (middle and right) before treatment and at 3 weeks. c, Fold change frequency (left) and MMI of Ki67 (right) of Tex, Tmem, and Teff subsets. d, Frequency of Tex cluster in PD-1+ CD8 T cells over time. e, SPADE tree coloured by MMI of Eomes (left) and CD39 (right) expression at 3 weeks (n =4). f, MMI of Eomes (left) and CD39 (right) of Tex, Tmem, and Teff subsets. g, Percentage of cells in Tex cluster (left) and Teff cluster (right) in PD-1+ CD8 T cells over time based on CyTOF and SPADE analysis. h, Frequency of Tex versus tumour burden coloured by response. Mass cytometry data in all panels are representative of one technical replicate. MMI shown in this figure represents arcsinh transformed data.

