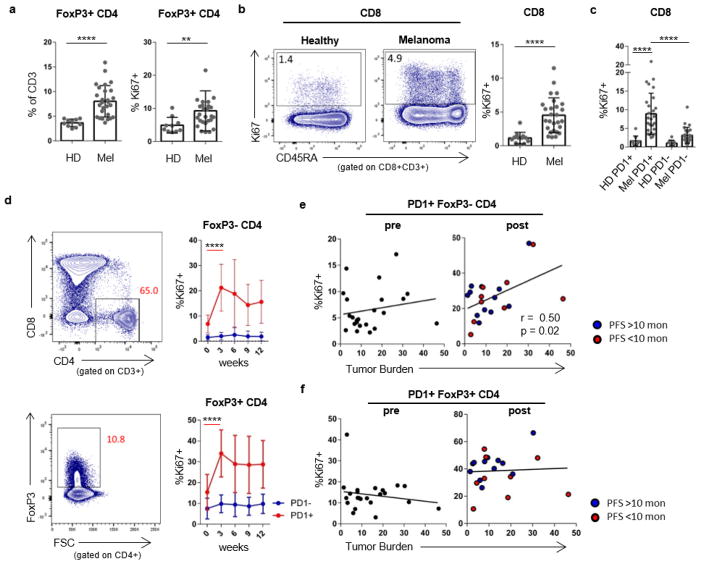
Extended Data Figure 2. CD4+FOXP3−, CD4+FOXP3+ and CD8 T cells from patients with melanoma have increased Ki67 expression compared to healthy donors.
a, Frequency and Ki67 expression in FOXP3+ CD4 T cells in healthy donors and melanoma patients. Student’s t-test. b, Ki67 expression in CD8 T cells between healthy donors and melanoma patients. Mann–Whitney U-test. c, Ki67 expression in PD-1+ and PD-1− CD8 T cells in healthy donors and patients with melanoma. Healthy donors versus patients, Mann–Whitney U-test; PD-1+ versus PD-1− CD8 T cells in patients with melanoma, Wilcoxon matched-pairs test. d, Ki67 expression in FOXP3− CD4 T cells and FOXP3+ CD4 cells over time. Wilcoxon matched-pairs test. e, Scatter plot of Ki67 expression in PD-1+CD4+FOXP3− T cells versus tumour burden by PFS. f, Ki67 expression in PD-1+CD4+FOXP3+ cells versus tumour burden by PFS (pretreatment, n =29; post-treatment, n =27 (e, f)). For all panels, **P <0.01, ****P < 0.0001. Error bars denote s.d. Flow cytometry data in all panels are representative of 1–4 independent technical replicates of the stain indicated.

