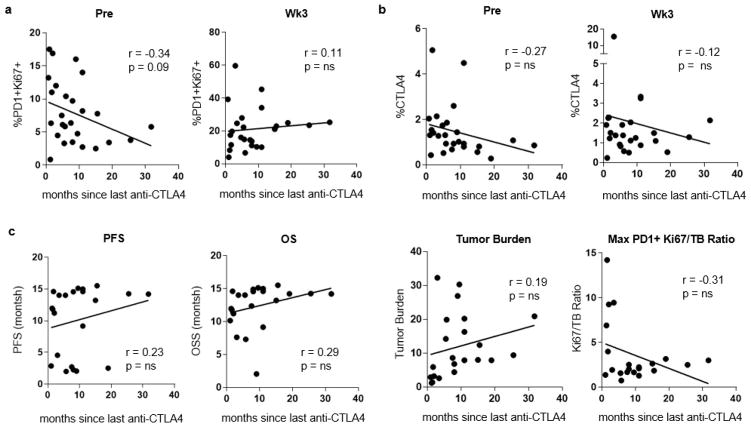
Extended Data Figure 4. Effect of anti-CTLA-4 therapy on Ki67 expression is restricted to the pretreatment time point.
a, Correlation of the percentage of PD-1+ CD8 T cells expressing Ki67 to months since last dose of anti-CTLA-4 (pretreatment, n = 26; week 3, n =25). b, Correlation of the percentage of CTLA-4 in CD8 T cells and months since last dose of anti-CTLA-4 (pretreatment, n = 26; week 3, n =25). c, Correlation of clinical parameters such as PFS, overall survival (OS), tumour burden, and Ki67 to tumour burden ratio with months since last dose of anti-CTLA-4 (pretreatment, n = 23; week 3, n =22). r and P values, Pearson’s correlations.

