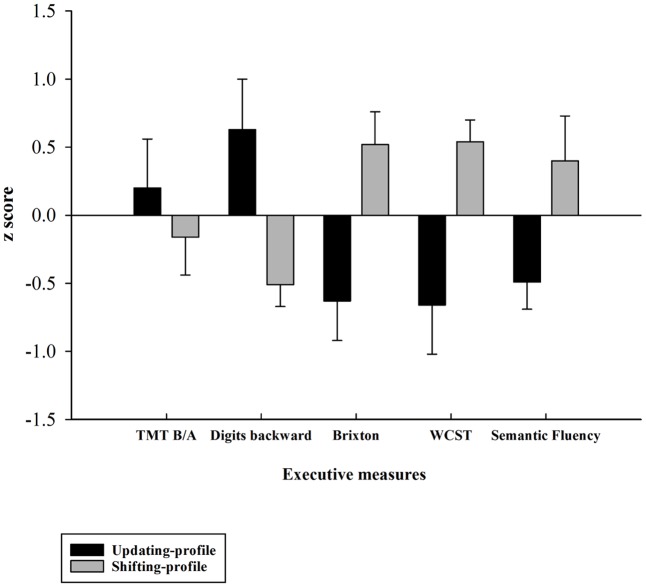
FIGURE 4.
Z-executive scores of the two older subgroups (updating-profile vs. shifting-profile) based on five executive measures: TMT B/A, digits backward, number of errors on the Brixton test, number of errors on the WCST, number of words produced correctly on the semantic fluency task). Tests for which increasing values in the original scores indexed lower performance were reversed in sign so that increasing values always reflected higher performance. Errors bars are represented by standard error mean values (SEM).

