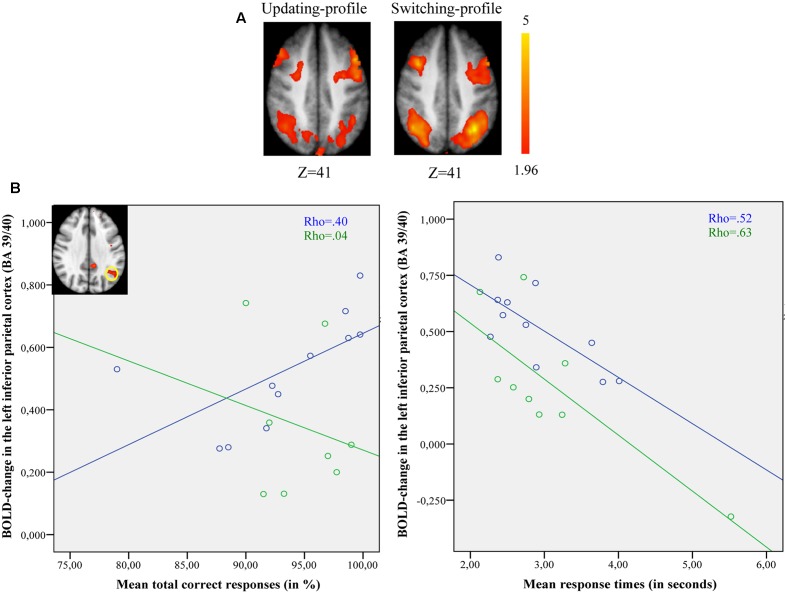
FIGURE 6.
(A) Brain activation for switch rule minus control matching. The updating-profile group (cf. left). The shifting-profile group (cf. right). (B) Correlation between the left inferior parietal cortex [BA 39/40; x = –33; y = –61; z = 39] and behavioral measures for the updating-profile group (green circles) and shifting-profile group (blue circles). The left plot represents the total correct responses and the right plot the mean response times. On the upper left, the shifting-profile group shows significant activation in the left inferior parietal cortex (BA 39/40) compared to updating-profile group.

