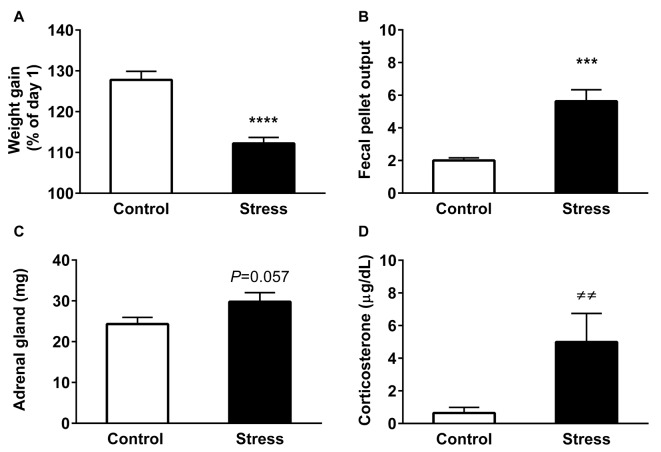
Figure 1.
Chronic restraint stress modifies physiological parameters. All graphs represent mean ± SEM of each group. (A) Variation of body weight gain was evaluated at the end point of treatment. All rats were weighed daily and one group was stressed during 14 consecutive days. (B) Fecal output was determined every day in control (2.5 h) and stressed animals during the stress session. Data represent the mean value/day. (C) Adrenal gland weight of control and stressed animals (D) Serum corticosterone (CORT) levels in control and stressed animals. Data represent mean ± SEM. Control (n = 15), Stress (n = 16). Data have a normal distribution with the exception of CORT levels. The former were analyzed by two-tailed t-test, ****P < 0.0001, ***P < 0.001, t-test two-tail. Differences in CORT levels were analyzed by two-tailed Mann-Whitney U test, ≠≠P = 0.0018.

