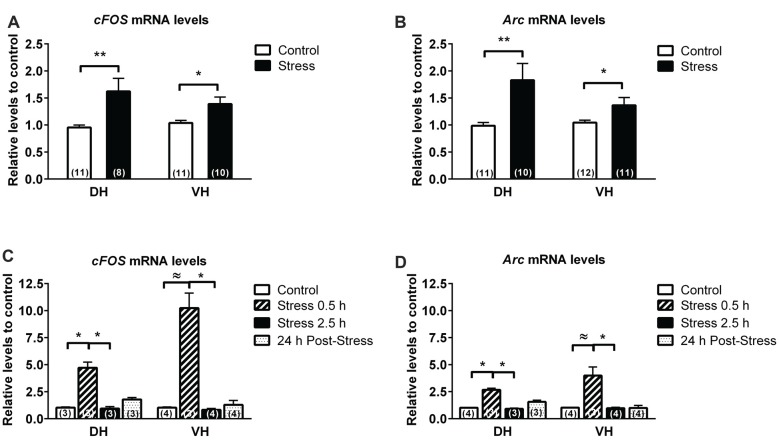
Figure 2.
Comparison in the expression of immediate early genes (IEG) in dorsal (DH) and ventral hippocampus (VH) of chronically and acutely stressed animals. RT-qPCR analysis of Fos (A,C) and Arc (B,D), evaluated in DH and VH of control and stressed animals. Data were analyzed by 2−ΔΔCt using β-actin as normalizer. Bar graphs represent mean ± SEM of each group. Number inside bars represent N° of animals. Differences between control and stressed animals were determined by two-tail Mann-Whitney test. **P < 0.01; *P < 0.05. Differences in control and acutely stressed animals were evaluated with Kruskal-Wallis test and Dunn’s post hoc test, *P < 0.05. Two-tail Mann-Whitney analysis was used to compare the effect of 0.5 h of stress with control. ≈P < 0.05.

