
Figure 1.
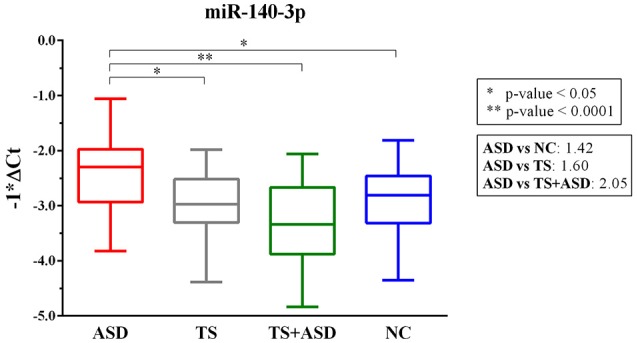
MiR-140-3p is significantly dysregulated in serum of ASD patients. Single TaqMan assay for miR-140-3p. Box and whiskers plot depicting serum levels of miR-140-3p in ASD, TS and TS+ASD patients and NCs. Y-axis represents the distribution of −1*ΔCt values for miR-140-3p. Multiplicity adjusted p-values from Tukey's multiple comparisons test and expression FC (Fold Change) values are shown in the boxes next to the plot.