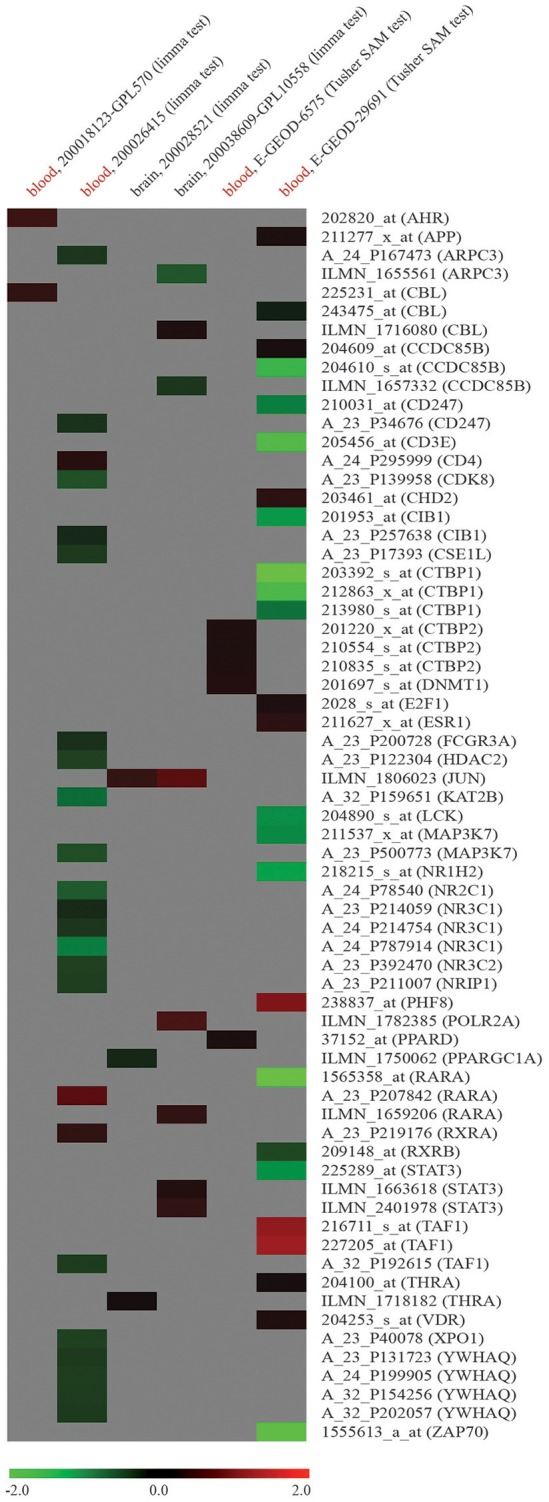
Figure 3.

Expression analysis of node genes within miR-140-3p-mediated regulatory network in human ASD high-throughput gene expression datasets retrieved from GEO DataSets and ArrayExpress. Datasets used for the expression analysis (human ASD source tissue, dataset ID, platform type, statistical test performed) and microarray probe IDs along with their corresponding gene symbols are reported in columns and lines of this gene expression heatmap, respectively. Colored heatmap cells represent genes that are DE in a certain dataset. Data are shown as log2FC expression values. For more information about gene expression trend, see figure legend.
