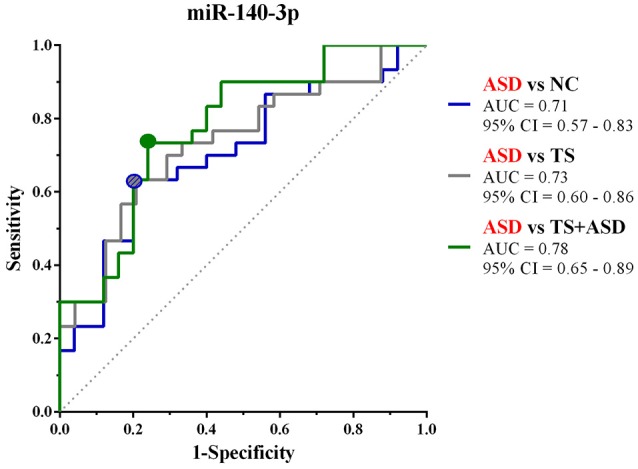
Figure 4.

Classical univariate ROC curve analyses for the comparisons in which miR-140-3p is dysregulated. This graph compares three ROC curves, one for each comparison where we found miR-140-3p to be dysregulated. Each point on the ROC curves represents a sensitivity/specificity pair corresponding to a particular decision threshold (ΔCt value cut-off). Circles on the curves refer to the sensitivity/specificity pairs with the highest Youden index J. AUC, Area under the ROC curve; 95% CI, 95% Confidence Interval.
