
Figure 5.
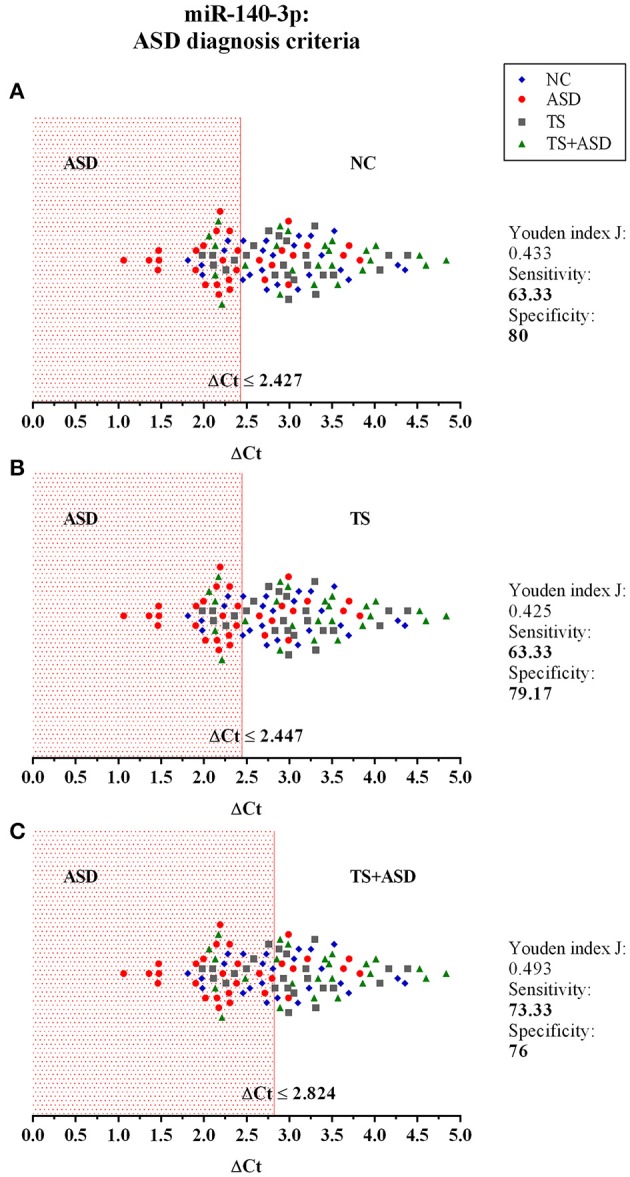
The potential use of serum miR-140-3p as a biomarker: criteria for ASD diagnosis. The graphs show the distribution of ΔCt values of all the 104 analyzed samples, for which we already had a clinical diagnosis. We used data from classical univariate ROC curve analyses to perform a blind diagnosis of all study participants. In (A), the ΔCt ≤ 2.427 criterion divides ASD patients from NCs and determines the correct discrimination of 19/32 ASD patients and 20/25 NCs. In (B), the ΔCt ≤ 2.447 criterion divides ASD patients from TS patients and determines the correct discrimination of 19/32 ASD patients and 19/24 TS patients. In (C), the ΔCt ≤ 2.824 criterion separates ASD patients from TS+ASD patients and determines the correct discrimination of 22/32 ASD patients and 19/25 TS+ASD patients.