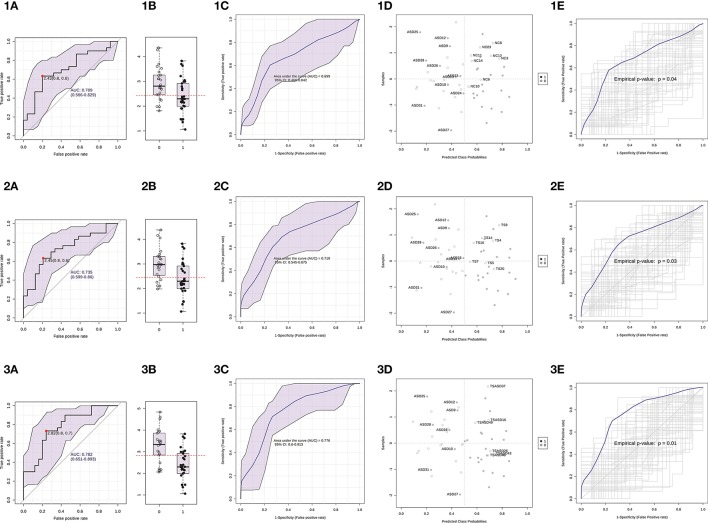
Figure 6.
Serum miR-140-3p could be used to discriminate ASD patients. (1) The graphs refer to the comparison ASD vs. NC. (2) The graphs refer to the comparison ASD vs. TS. (3) The graphs refer to the comparison ASD vs. TS+ASD. (A) Classical univariate ROC curve analysis. The red dot represents the sensitivity/specificity pair with the highest Youden index J. (B) Boxplot depicting the distribution of ΔCt values in the two groups. The red line represents the ΔCt value cut-off corresponding to the red dot on the curve in (A). The label 1 refers to the ASD group, 0 to the other group. (C) Average ROC curve from 100-time repeated random sub-sampling CV of the built logistic regression model. (D) Average predicted class probabilities (x-axis) of each sample (y-axis) from the 100 CV iterations. Probability scores more than 0.5 belong to the ASD group, those less than 0.5 belong to the other group. Incorrectly classified subjects are identified by their ID number. (E) Results from the permutation tests on the model performance measure AUC. Average ROC curve and corresponding p-value are reported. AUC, Area under the ROC curve; 95% CI: 95% Confidence Interval; CV, cross-validation.

