Figure 3.

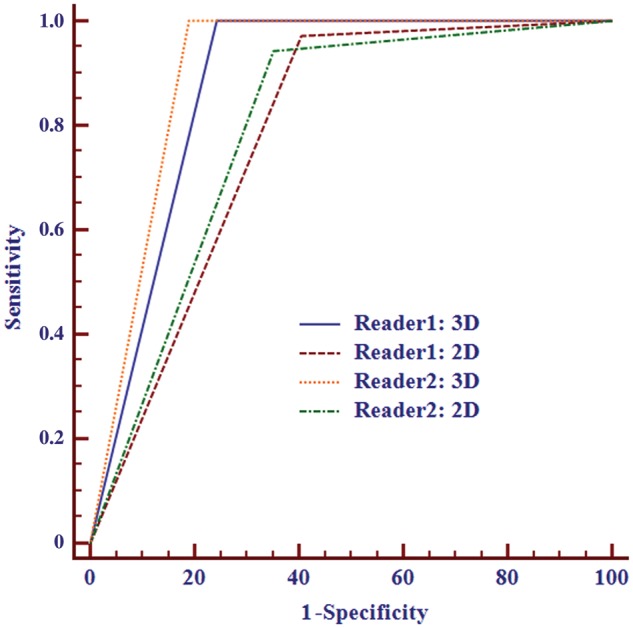
ROC curves of rectal cancer T restaging (T0–2/T3–4) using 3D and 2D datasets. The AUC of 3D was higher than that of 2D for both readers.

ROC curves of rectal cancer T restaging (T0–2/T3–4) using 3D and 2D datasets. The AUC of 3D was higher than that of 2D for both readers.