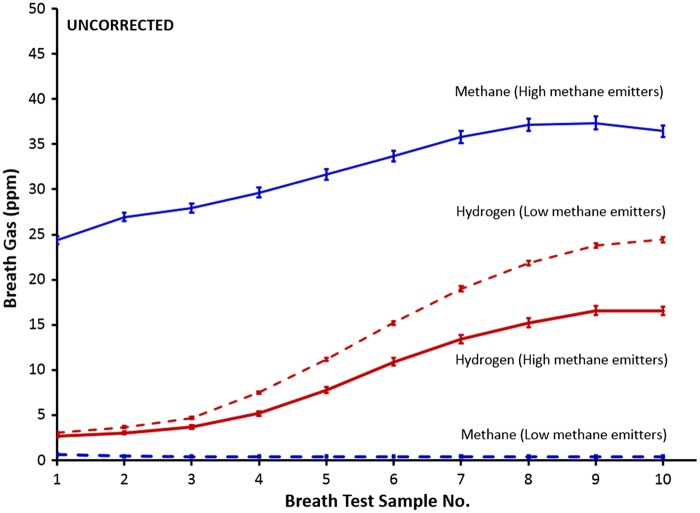
Figure 3.
Time course of the average hydrogen- (red) and methane production (blue) in subjects who were either high- or low-level methane emitters, based on the reference standard (North American Consensus) (mean ± standard error) over 10 samples spaced 20 minutes apart (numbered from 1 to 10). No correction factor was applied.

