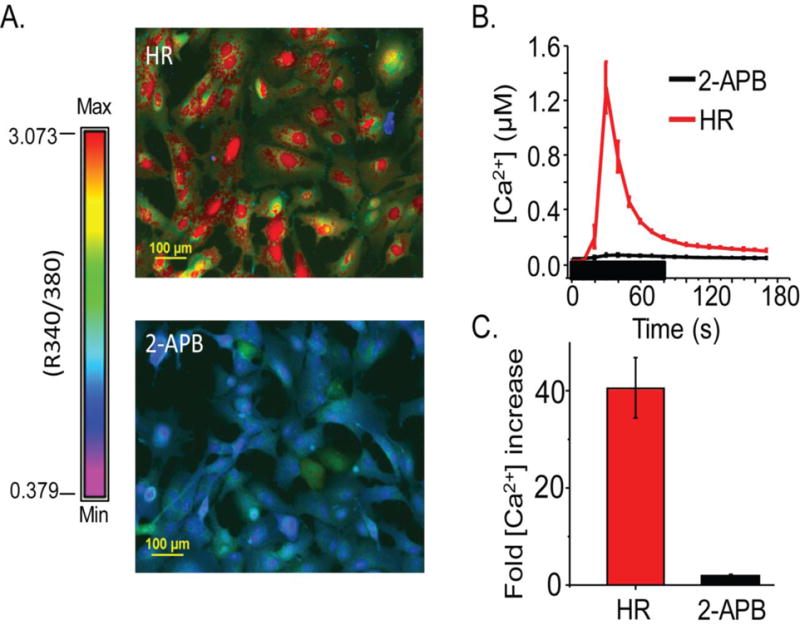
Fig. 4.

hfRPE OXT response is inhibited by the IP3R antagonist, 2-APB. A) Example of Ca2+ response to OXT in HR solution compared to OXT response in 2-APB treated cells. Color spectrum with max and min R (340/390) used to calculate [Ca2+]i provided. (B) An average trace taken from an entire (20X) visual field of hfRPE cells showing the change in [Ca2+]i when stimulated with 10 μM OXT in HR (pink) and 10 μM OXT in 60μM 2-APB (black). (C) Fold increase in [Ca2+]i after 10 μM OXT treatment in HR (black) or 60μM 2-APB (red), relative to baseline taken by averaging five points prior to treatment. This plot demonstrates a significant inhibition (P<.0001) in the Ca2+ response in hfRPE cells following treatment with 2-APB.
