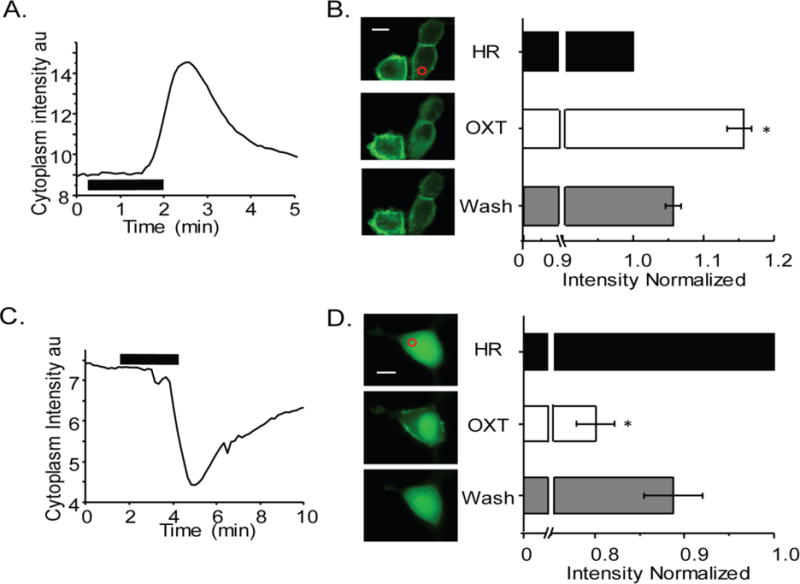
Fig. 6.

OXT activation of OXTR results in PIP2 hydrolysis in HEK-OXTR cells. A) Representative GFP fluorescence time course within the cytoplasmic region shows OXTR receptor activation by 6 μM OXT (horizontal line) induced a translocation of the PIP2 indicator PH-GFP from the plasma membrane to the cytosol that completely reversed upon removal of OXT. B) On the left PH-GFP transfected cells shown before (top), during (middle) and after (bottom) OXT treatment with ROI indicated as red circle. The average of normalized fluorescence intensity change within the cytoplasmic domain is shown on the right from four experiments. C) Representative GFP fluorescence time course within the cytoplasmic ROI shows OXTR receptor activation by 6 μM OXT (horizontal line) induced a translocation of the PKC-GFP (indicator of DAG) from the cytosol to the plasma membrane that completely reversed upon removal of OXT. D) On the left images of PKC-GFP expressing cell shown before (top), during (middle) and after (bottom) OXT treatment with ROI indicated as red circle. On the right average plot of normalized fluorescence intensity values within the cytoplasmic domain from three experiments and reported as mean ± SEM. Scale bar in B and D is 10 μm and * indicates P < 0.001.
