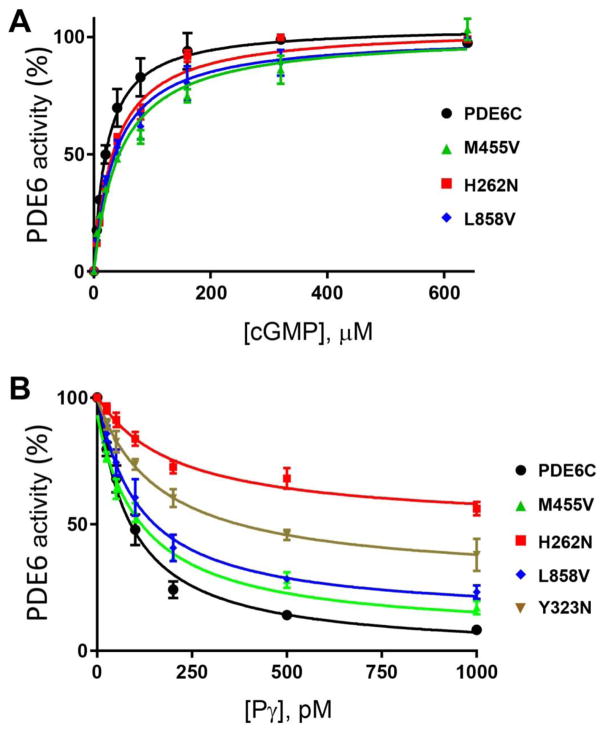
Fig. 4. Characterization of mutant PDE6C proteins.
A. The rates of cGMP hydrolysis were measured in the presence of increasing concentrations of cGMP in hypotonic extracts obtained from HEK293T cells co-transfected with the AIPL1-Pγ vector and the WT or mutant PDE6C. PDE6C activity is expressed as a percentage of maximal activity. PDE6C, KM=24±2 μM; PDE6C-M455V, 42±11 μM; PDE6C-H262N, KM=30±2 μM; PDE6C-L858V, KM=32±3 μM. Results are shown as Mean±SE. B. Pγ-inhibition of PDE6C activity in hypotonic extracts of HEK293T cells co-transfected with AIPL1 and the WT or mutant PDE6C. PDE6C, Ki=88±21 pM; PDE6C-Y323N, Ki=176±28 pM (maximal inhibition 72±6%); PDE6C-M455V, Ki=98±4 pM; PDE6C-H262N, Ki=222±49 pM (maximal inhibition 51±1%); PDE6C-L858V, Ki=114±37 pM. Results are shown as Mean±SE.

