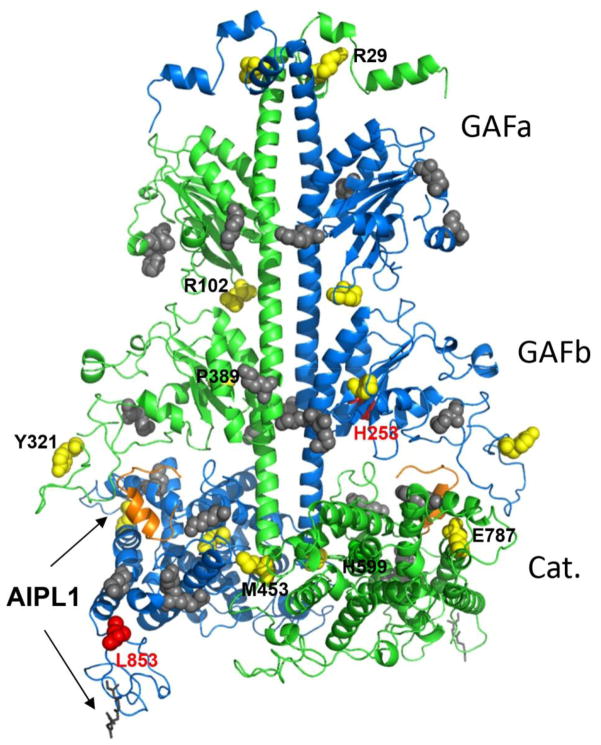
Fig. 6. Map of disease-causing PDE6 mutations and the Pγ-interaction sites.
Residues corresponding to pathogenic substitutions in human PDE6 catalytic subunits are mapped on the cluster 1 model of bovine rod PDE6AB derived from a high-density crosslinking study, which also identified residues cross-linked with Pγ (shown as grey spheres) [33]. The backbones of PDE6A and PDE6B are shown in green and blue, respectively. PDE6A and PDE6B residues corresponding to the ACMH-linked residues in human PDE6C are shown as yellow spheres, but labeled only for the PDE6A subunit for clarity. Bovine PDE6B residues corresponding to those mutated in Rambusch adCSNB and RP are shown as red spheres. The farnesyl and geranylgeranyl lipid modifications of the C-terminal CAAX box are shown as grey sticks. The C-terminal inhibitory fragment of Pγ superimposed from the structure of the PDE5/6 catalytic domain (PDB ID 3JWR) [35] is shown as an orange cartoon. Arrows indicate probable AIPL1-PDE6 interface based on known interactions of AIPL1 with the prenyl moieties and Pγ [26, 39, 46].

