
Figure 3. A single ssDNA molecule concomitantly invades two donors and cause their translocation.
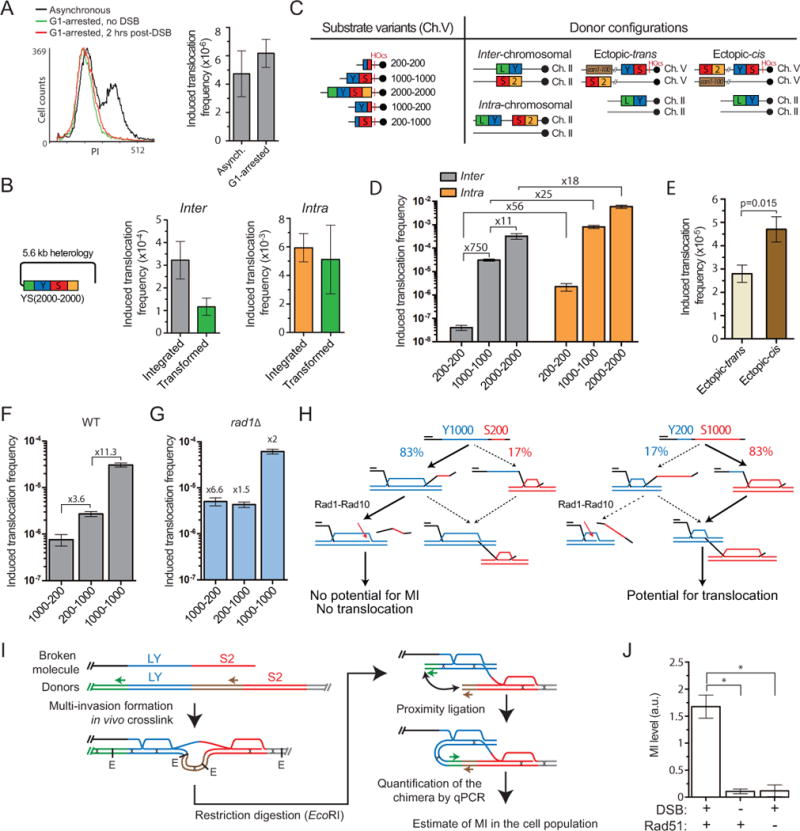
(A) FACS profile and induced translocation frequency in asynchronous or G1-arrested cells. (B) Translocation frequency induced with either an integrated or a transformed YS2000-2000 construct in strains bearing the donors in the inter-chromosomal or intra-chromosomal configuration (Figure 3C). (C) Scheme of substrate length variants and donor configurations. (D) Homology length and physical proximity of the donors stimulate translocation frequency in wild type. (E) Induced translocation frequency in the ectopic-trans and ectopic-cis donor configurations. (F, G) Induced translocation frequency in wild type (F) or rad1Δ (G) with asymmetric homology length variants. (G) Fold over wild type is indicated. (A, C–G) Bars represent mean ±SEM. (H) Model for the Rad1-dependent differential effect of the DSB-proximal and -distal length of homology on MIR. (I) Rationale of MI-Capture assay. (J) The MI signal is DSB- and Rad51-dependent. Bars represent mean ±SEM of qPCR signal normalized over a control (ARG4) on Ch. VIII in wild type either un-induced (n=9) or 3 hrs after DSB induction (n=7), or in rad51Δ 3 hrs after DSB induction (n=3). *p<0.05. Controls for HOcs cleavage and ligation efficiency are reported in Figure S2F, G.