
Figure 5. Physical analysis of MIR translocants.
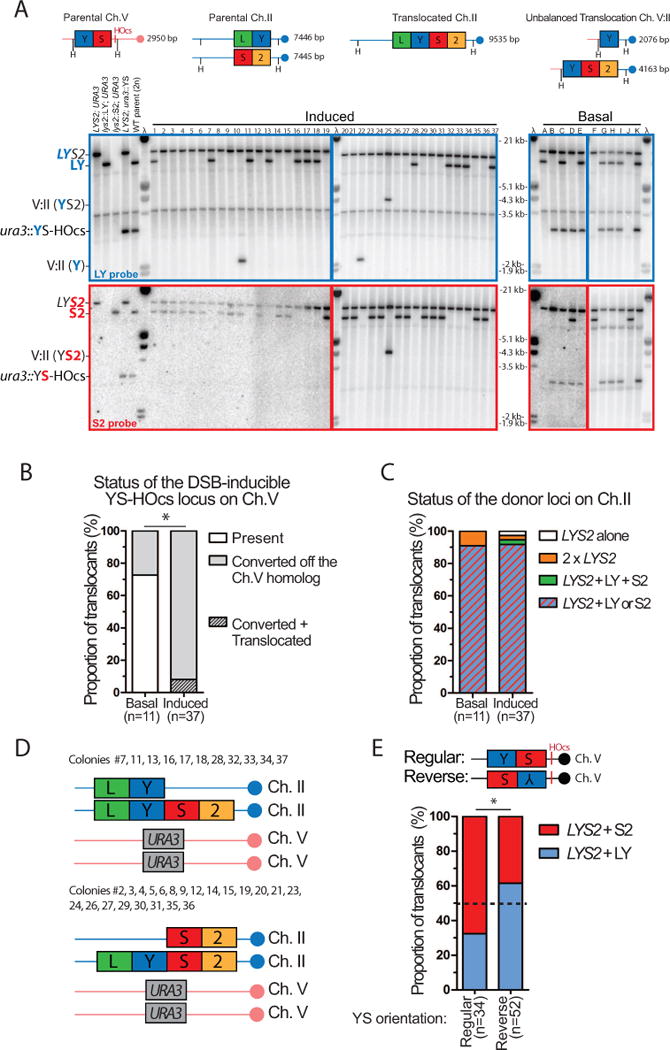
(A) Southern blot analysis of basal (n=11) or induced Lys+ cells (n=37, normal colony size) obtained with the wild type inter-chromosomal strain. The expected size of the parental and translocated molecules upon HindIII digestion is shown on the left panel. Blots were probed with either the LY (top, blue) or the S2 probe (bottom, red) and phage λ DNA (molecular ladder). (B) Status of the DSB-inducible YS-HOcs construct in basal and induced cells. Translocated refers to Ch. V:II translocations depicted in (A). (C) Summary of the donor segregation pattern together with LYS2. (D) Summary of the genetic content of normal-size translocants exhibiting no additional chromosomal abnormalities (33/37). (E) The translocated LYS2 gene segregates preferentially with the donor corresponding to the DSB-proximal homology. Southern blot analysis of translocants induced with a DSB-inducible construct bearing the YS sequence in reverse orientation is shown Figure S4C. (B, E) *p<0.05, Fisher’s exact test.