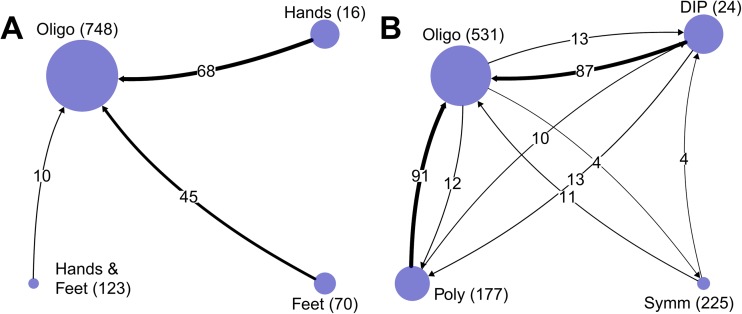
Fig. 3.
Transition of patients between clusters (a) and traditional PsA subtypes (b) going from inclusion to follow-up. Arrows indicate direction of transition as well as number. Circles indicate the size of the respective clusters at inclusion. Absolute numbers at the respective start points are given in parentheses. The ‘Hands & Feet’ circle corresponds to the ‘polyarticular cluster’ from the text

