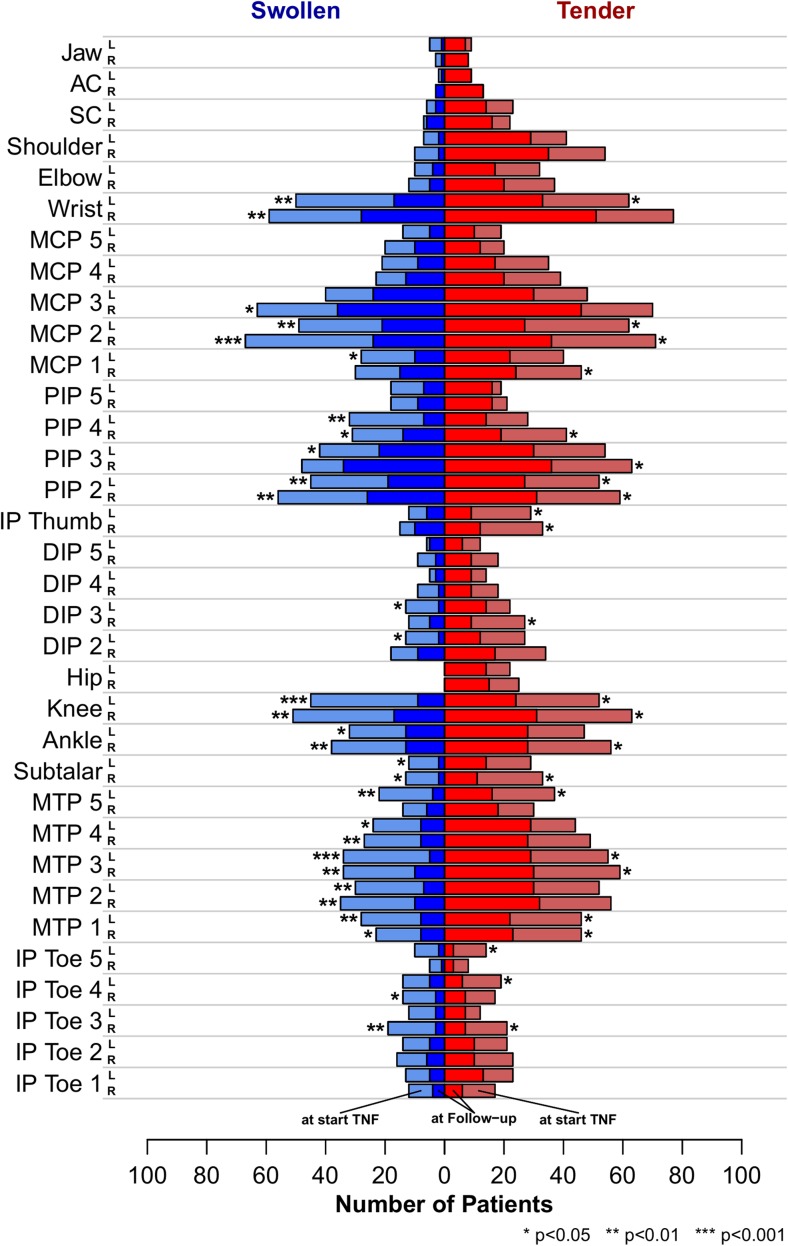
Fig. 4.
Counts of joint swelling and tenderness before and after anti-TNF-α treatment. Joint swelling (blue) or tenderness (red) before start of anti-TNF-α treatment (lighter colours) and frequency of joint involvement at follow-up visit (darker). Stars indicate level of significance from a per location Fisher’s exact test. False discovery rate was controlled using Benjamini-Hochberg correction (colour figure online)

