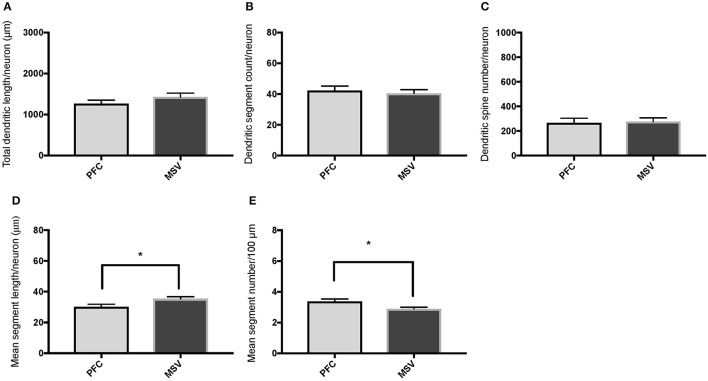
Figure 5.
Bar graphs comparing basal dendritic variables in supragranular layers (layers II/III) of the prefrontal cortex (BA 10, BA 11) and the motor-sensory-visual areas examined (MSV; BA 4, BA 3, BA 18) in subject WS 6 (47 year-old, male): (A) total dendritic length (TDL, μm); (B) dendritic segment count (DSC); (C) number of dendritic spines (DSN); (D) mean segment length (MSL, μm), and (E) mean number of dendritic segments (MSC). Data are presented as mean ± SEM. *P ≤ 0.05.

