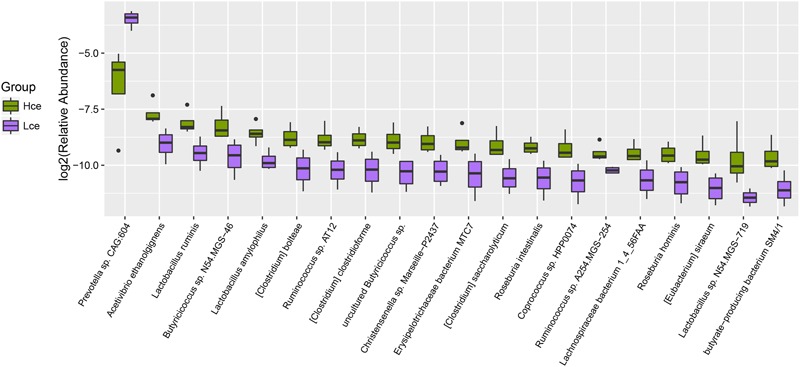
FIGURE 3.

Boxplot for top 20 differentially enriched species between the Hce and Lce groups. Hce, cecal microbiota of high FE group. Lce, cecal microbiota of low FE group.

Boxplot for top 20 differentially enriched species between the Hce and Lce groups. Hce, cecal microbiota of high FE group. Lce, cecal microbiota of low FE group.