Figure 3.
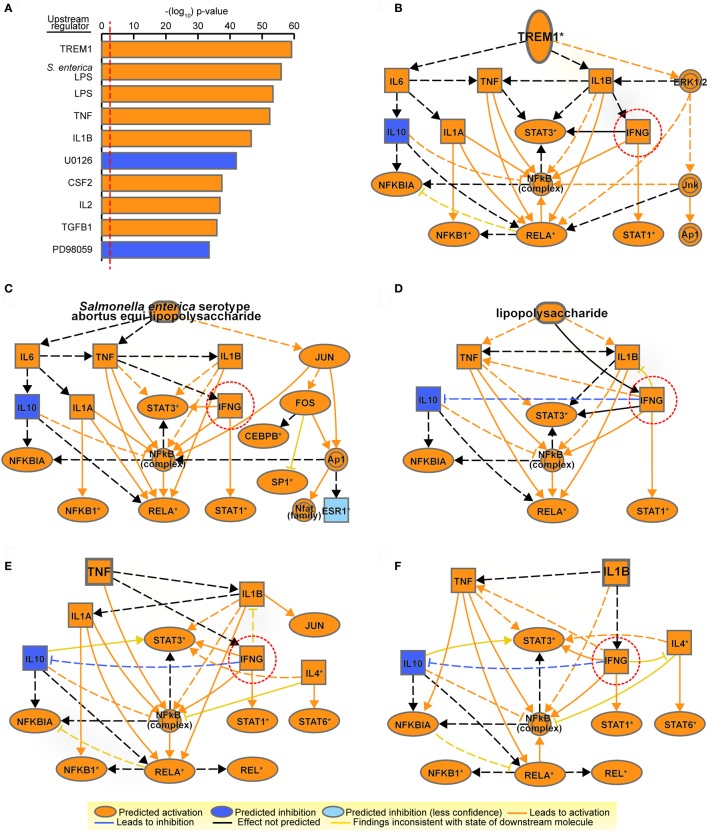
Mechanistic networks for the most significant upstream regulators identified in M2-bacillus Calmette–Guérin (BCG) indicate a potential for influencing T cells. (A) Top-10 upstream regulators predicted by Ingenuity Pathway Analysis from the list of differentially expressed genes in M2-BCG compared to M2. Regulators are ranked by multiple hypothesis corrected overlap p-values. Predicted activation status is shown in orange (for activated) or in blue (for inhibited). S. enterica LPS, Salmonella enterica serotype abortus equi lipopolysaccharide; U0126, succinonitrile bis(amino(o-aminophenylthio)methylene); PD98059, 2′-amino-3′-methoxyflavone. (B–F) Mechanistic networks for the top five most significant upstream regulators: (B) triggering receptor expressed on myeloid cells 1 (TREM1); (C) S. enterica serotype abortus equi lipopolysaccharide; (D) lipopolysaccharides; (E) TNF; (F) IL1B. A potential for influence on T cells is indicated by the predicted presence of IFNG (dotted circle) in all five networks. Nodes and edges are represented according to their predicted activation status.

